The USDJPY extends lower in early Thursday’s trading, following nearly 1% drop on Wednesday, as yen was supported by increased flow into safety on risk aversion.
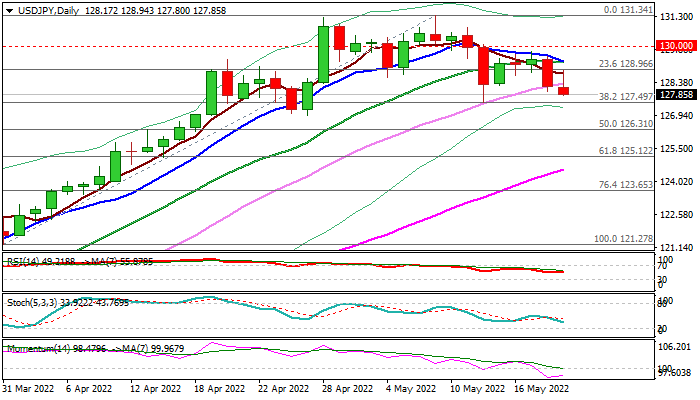
Negative signal is developing on daily chart as near-term recovery attempts from May 12 low at 127.51 repeatedly failed to clear daily Tenkan-sen (129.42) forming a bull-trap pattern.
In addition, daily 10/20DMA converged and on track to form a bear-cross, while 14-d momentum dipped into negative territory.
Fresh bears broke below daily Kijun-sen (128.21) and pressure pivotal supports at 127.50 zone (May 12 low / double- Fibo, 38.2% of 121.27/131.34 upleg / 23.6% of 114.64/131.34) violation of which would add to bearish signals on completion of failure swing pattern on daily chart and open way for deeper drop.
A higher base at 127.00 zone (Apr 26/27 lows) marks next target, followed by 126.31 (50% of 121.27/131.34).
Daily close below Kijun-sen to maintain strong bearish bias, while Tenkan-sen marks an upper breakpoint.
Res: 128.21; 128.94; 129.42; 129.78
Sup: 127.50; 127.00; 126.31; 125.22