
EUR/USD
The common currency had a rough day, falling down to 1.1832 against the greenback, to end the day not far above the level. The EUR was hit at the beginning of the week by the outcome of German’s election, as Merkel’s party got a minor victory, with 33% of the votes, while the far-right AfD got 12.6%, making it to the Parliament for the first time since WWII. Merkel, will now to have to form a coalition to govern Germany, particularly after the SPD leader, Martin Schulz who came in second with a 20.5%, ruled out the possibility of a coalition with Merkel’s CDU party. Also, the German IFO survey showed that German manufacturers ramped up their investment in September, but not to the extent originally planned. Business climate was down to 115.2 in September, from a previously revised 115.7 and against the 116.00 expected. There were no big headlines coming from the US, but escalating tensions between the country and North Korea triggered demand for safe-haven assets in the US afternoon, dragging the pair further lower, after North Korean foreign minister Ri Yong Ho said that US Trump’s comments over the weekend were clearly a declaration of war.
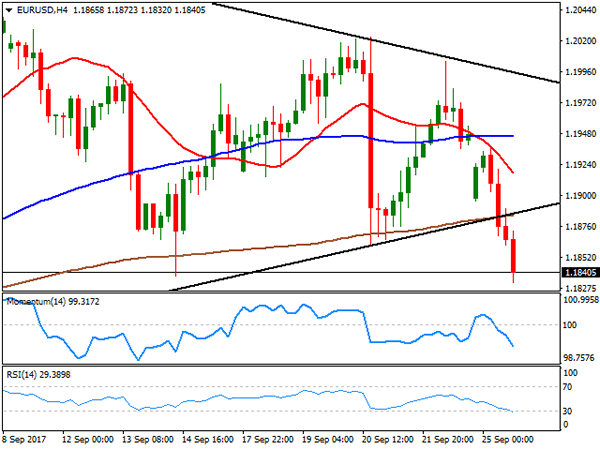
This Tuesday, US Fed Yellen is due to deliver a speech titled "Inflation, Uncertainty, and Monetary Policy" at the National Association for Business Economics Annual Meeting, in Cleveland, but seems unlikely she would offer something that can surprise market players, after last week’s statement. Technically, the pair is poised to extend its decline, back near the key support around 1.1820/30, where the pair bottomed these last few weeks. The 4 hours chart shows that the price broke below a daily ascendant trend line coming from mid August, which converges with the 200 SMA around 1.1885, making of the level a strong intraday resistance for the upcoming sessions, whilst in the same chart, technical indicators maintain a strong bearish momentum near oversold territory, supporting a bearish breakout of the August/September range.
Support levels: 1.1820 1.1775 1.1730
Resistance levels: 1.1885 1.1930 1.1965
USD/JPY
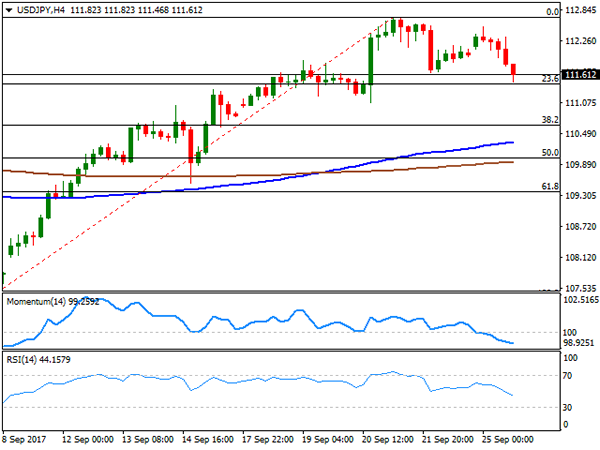
The Japanese yen retakes the upside against its American rival during the last session, following comments coming from North Korean foreign minister, Ri Yong Ho, who said that US President Donald Trump’s comments over the weekend were clearly a declaration of war and therefore, they have every right to take countermeasures, including the right to shoot down strategic US bombers even if they are not in North Korean airspace. US equities, which were off to a soft start, fell further, whilst US Treasury yields trimmed most of last week’s gains. The 10-year note benchmark is down to 2.22%, after closing last Friday at 2.26%. The pair fell down to 111.46 before bouncing modestly, holding into the red for the day, and close to trim all of the Fed-related gains triggered last week. The 4 hours chart indicates that the pair bounced from near a critical support, the 23.6% retracement of the 107.31/112.71 rally around 111.40, now the immediate support. The same chart shows that technical indicators gained downward momentum within bearish territory, but also that the price remains well above its 100 and 200 SMAs. In the 111.40 area, the pair also has its 200 DMA, reinforcing the strength of the level, and giving stronger implications to a bearish breakout of such level.
Support levels: 111.75 111.40 111.00
Resistance levels: 112.10 112.40 112.85
GBP/USD
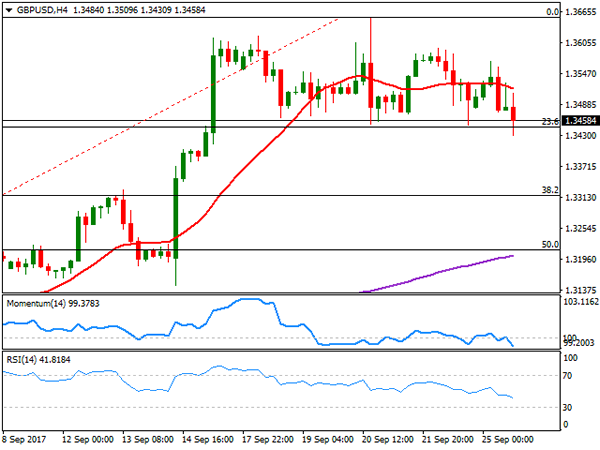
The GBP/USD pair ended the day marginally lower, undermined by broad dollar’s strength. The pair extended last week’s slide by a couple of pips, printing 1.3430 before recovering to settle above a major Fibonacci support at 1.3450, the 23.6% retracement of 1.2773/1.3553 rally. The UK had nothing to offer from the macroeconomic front, although the fourth round of Brexit negotiations began in Brussels. UK’s Brexit minister, David Davis, said that there could be "no excuses" to progress within negotiations, but once again insisted that the divorce-bill should be linked to a deal on future ties, against EU’s negotiators stance, which want to settle the bill before moving forward. The pair is slowly gaining downward traction according to intraday readings, although a clear break of the mentioned support is still required, to anticipate further slides towards the 1.3320 region, where the pair has the 38.2% retracement of the same rally. In the hours chart, the price has now extended below its 20 SMA that slowly turned lower, whilst technical indicators accelerated south within bearish territory, in line with a bearish extension during the upcoming sessions.
Support levels: 1.3450 1.3410 1.3370
Resistance levels: 1.3490 1.3535 1.3560
GOLD
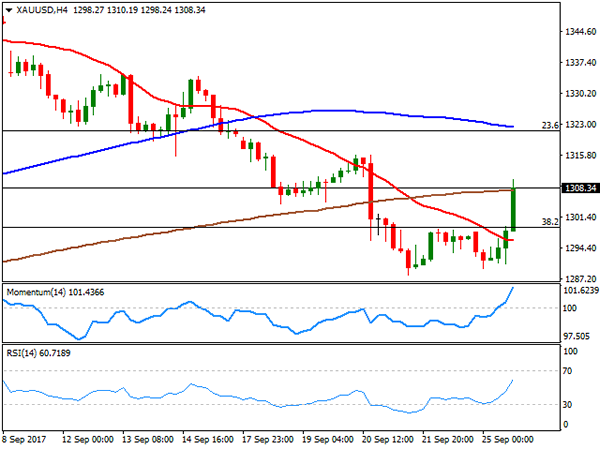
Gold prices skyrocketed through the 1,300.00 level, with spot trading as high as $1310.19 a troy ounce, its highest since last Wednesday, when Fed’s monetary policy announcement sent it sharply lower. The commodity settled a few cents above 1,308.00, rallying as a result of renewed geopolitical jitters between the US and North Korea, after the N. Korean foreign minister said that the latest US Trump comments were a declaration of war. The commodity started the day with a soft tone, following EUR’s lead which plunged following German’s election outcome, trading as low as $1,289.49 a troy ounce before turning sharply up on risk aversion. Technically, the daily chart shows that the current recovery is not enough to revert the bearish tone, but at least took off some of the downward pressure, and left doors open for further recoveries, as technical indicators are recovering from oversold levels, whilst the price recovered above the 38.2% retracement of its latest bullish run at 1,299.00. Nevertheless and in the same chart, the price remains well below a still bearish 20 SMA, now converging with the 23.6% retracement of the same rally at 1,321.44. Shorter term, and according to the 4 hours chart, the commodity is poised to recover further, now trading above its 20 and 200 SMAs, and with technical indicators heading sharply higher above their mid-lines.
Support levels: 1,299.00 1,288.10 1,280.45
Resistance levels: 1,311.60 1,321.45 1,334.20
WTI CRUDE OIL
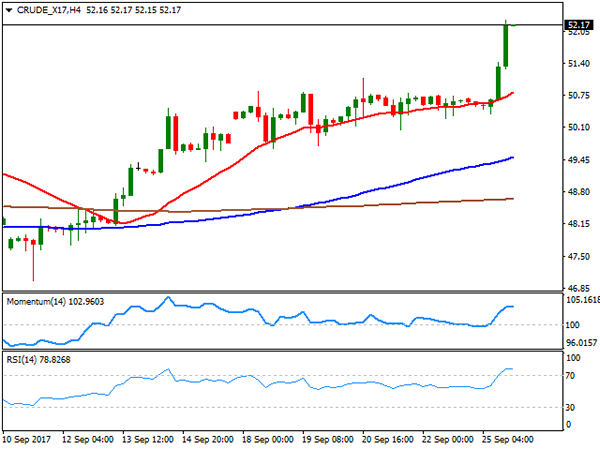
Crude oil prices rallied to fresh multi-month highs, with WTI futures ending the US session around $52.20 a barrel, adding roughly 3% on the day. The commodity found support on speculation the OPEC and non-OPEC producers who signed a pact to cut output last November, will extend its past its expiration date in March next year, alongside with hopes of increased demand, which will help the market rebalance. The US benchmark trades at its highest since last April, when it topped at 53.74, and technical readings in the daily chart support some further gains ahead, as the 20 SMA has overcome the 200 SMA, while technical indicators entered overbought territory with almost vertical bullish slopes. In the shorter term, and according to the 4 hours chart, the risk is also towards the upside, as technical indicators hold within overbought territory, losing upward strength amid decreasing volume at this time of the day, rather than signaling upward exhaustion. Also, the price has accelerated far above all of its moving averages, further supporting additional gains ahead for oil, moreover on an extension above52.26, the daily high and the immediate resistance.
Support levels: 51.65 50.90 50.40
Resistance levels: 52.25 52.90 53.70
DJIA
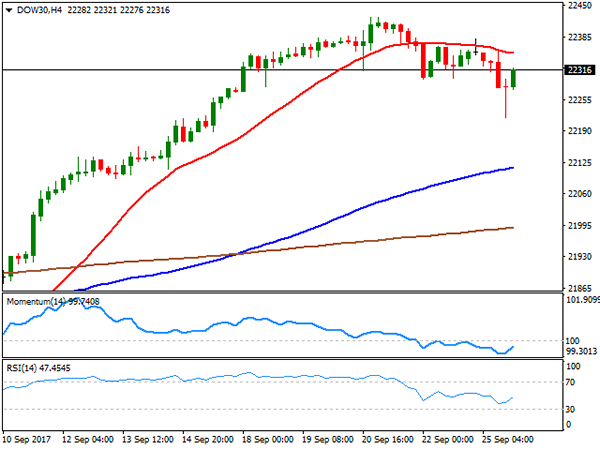
Wall Street closed in the red at the beginning of the week, as risk aversion, alongside with falling tech equities, undermined US indexes. The DJIA lost 53 points, to end at 22,296.09, while the Nasdaq composite shed 0.88% to end at 6,370.59. The S&P closed at 2,496.66 down 0.22%. Within the Dow, Exxon Mobil was the best performer, adding 1.34% amid a sharp advance in oil prices, followed by General Electric that gained 1.05%. Visa led decliners shedding 2.44%, followed by McDonald’s that closed 1.64% lower. The Dow, however, ended the day well -off its daily low of 22,217, and the daily chart shows that the downward potential remains limited, given that technical indicators are barely retreating from overbought levels, as the price remains well above all of its moving averages. Shorter term, and according to the 4 hours chart, the index is still below its 20 SMA, while technical indicators have managed to recover partially within negative territory, reflecting the latest intraday bounce rather than suggesting further gains ahead.
Support levels: 22,297 22,258 22,216
Resistance levels: 22,370 22,424 22,475
FTSE100
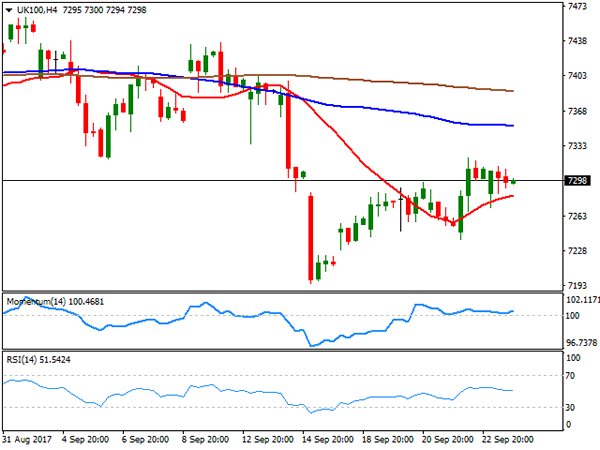
The FTSE 100 shed some ground this Monday, down 9 points or 0.13% to close at 7,301.29, affected by Pound’s strength, early London and falling metal prices, weighing on mining-related currencies. Also, a report from the BOE warning about risks for credit growth hurt banking-related equities. Mediclinic International was the worst performer, down 5.14%, followed by Antofagasta and Anglo American, down over 3% each. ConvaTec led gainers, up 1.50%, followed by BT Group, which added 1.47%. The technical outlook for the index is little changed from Friday’s view, as the index remains well below a bearish 20 SMA, also below the 100 SMA, while technical indicators remain within bearish territory, and particularly the RSI gains favors the downside, currently around 45. Shorter term, and according to the 4 hours chart, the index continues consolidating above a bullish 20 SMA, whilst technical indicators keep hovering above their mid-lines, with limited upward strength.
Support levels :7,280 7,236 7,195
Resistance levels: 7,344 7,381 7,422
DAX
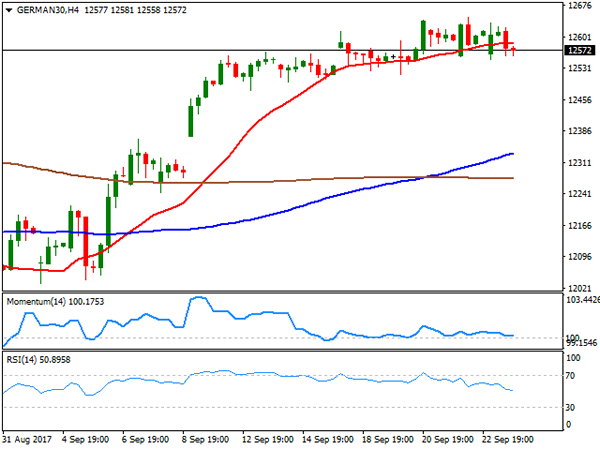
The German DAX added 2 points, to end the day at 12,594.81, as despite the EUR plunged, a decline in banking and mining-related equities dragged European indexes lower. Most members were down within the DAX, with RWE AG leading decliners, down 5.65%, followed by Commerzbank that lost 2.79%. The best performer was Merck, which added 1.97%, followed by Bayer up at the end of the day by 1.14%. The index remains within a consolidative stage, with no upward strength but with the downside potential limited, as the index holds far above all of its moving averages, whilst technical indicators are barely losing upward momentum holding near overbought levels. In the 4 hours chart, the index is neutral, but with an increased bearish potential, as the index closed below a horizontal 20 SMA, while the Momentum indicator holds flat around its 100 level, and the RSI indicator gains bearish traction, but currently at 49.
Support levels: 12,537 12,489 12,439
Resistance levels: 12,584 12,630 12,677


