EUR/USD
The greenback gained ground at the beginning of the day, but changed course in the American afternoon to end the day marginally lower against the EUR. The pair traded as low as 1.1695 on the back of persistent dollar’s demand, fueled during Asian trading hours by a dovish RBA, which not only kept the monetary policy unchanged, but also voiced its concern about Aussie’s strength. The European and US macroeconomic calendars had little to offer, with the EU releasing August PPI, up in the month by 0.3% and by 2.5% when compared to a year earlier, having not much effect over the common currency. In the US, the NY ISM Business Conditions Index dropped into contraction territory in September, down to 49.7 from August 56.6, putting the greenback under short-term pressure in the absence of more relevant news.
This Wednesday, market’s attention will focus on the final Services and Composites PMIs figures for both economy, while more relevant, ECB’s Draghi and Fed’s Yellen are scheduled to speak in different events. They are set to deliver opening remarks, Draghi at the inauguration of the ECB visitor center in Frankfurt, and Yellen at a banking conference in St. Louis. Market players will be scrutinizing their words for clues on upcoming monetary policy decisions.
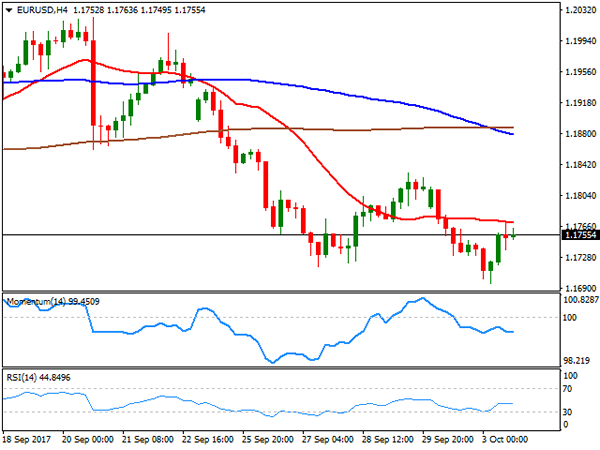
The EUR/USD pair closed the day in the 1.1750, and despite a few pips up for the day, it posted a lower low and a lower high daily basis, a sign that the dominant bearish trend remains firm in place. In the 4 hours chart, an early attempt to recover ground was contained by selling interest around a flat 20 SMA, currently around 1.1770, while technical indicators remain within bearish territory, with limited downward strength amid the restricted intraday action seen this Tuesday. The key support, in the case of further slides comes at 1.1660, August monthly low, with a break below the level opening doors for an extension towards 1.1460 the level that contained rallies for most of 2015 and 2016. The bearish pressure may ease on a recovery above the 1.1820/30 region, but a stronger advance is still out of sight.
Support levels: 1.1720 1.1690 1.1660
Resistance levels: 1.1770 1.1825 1.1860
USD/JPY
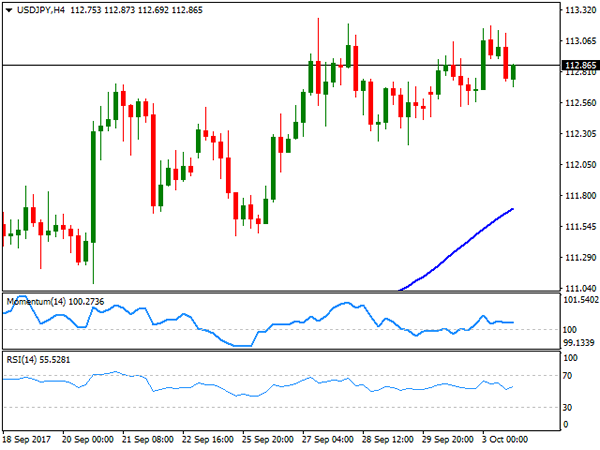
The USD/JPY pair maintained the positive tone, but there was no follow-though, with the pair still consolidating around 113.00. It traded as high as 113.19 intraday, backed by an advance in US Treasury yields, as the 10-year note benchmark traded as high as 2.35% while the 30-yer bond yield reached 2.89% mid-day. Softer-than-expected US data pushed yields and the pair marginally lower in the US session, with the pair ending the day up anyway, at 112.85. There’s no data scheduled in Japan during the upcoming Asian session while China will remain on holidays, anticipating further quietness around the pair. Clues will come from local equities, which will likely follow Wall Street’s positive lead, therefore keeping the pair afloat. Ahead of the Asian opening, the 4 hours chart maintains a neutral-to-bullish technical stance, as indicators continue heading nowhere around their mid-lines, but the price is developing well above bullish moving averages, with the 100 SMA now standing around 111.70. The pair still needs to accelerate through 113.25, where it topped last week, to be able to advance further, eyeing then a major static resistance at 114.40. Still the pair can continue ranging ahead of US employment data to be released next Friday, usually a big market mover for the pair.
Support levels: 112.60 112.20 111.85
Resistance levels: 113.25 113.60 114.40
GBP/USD
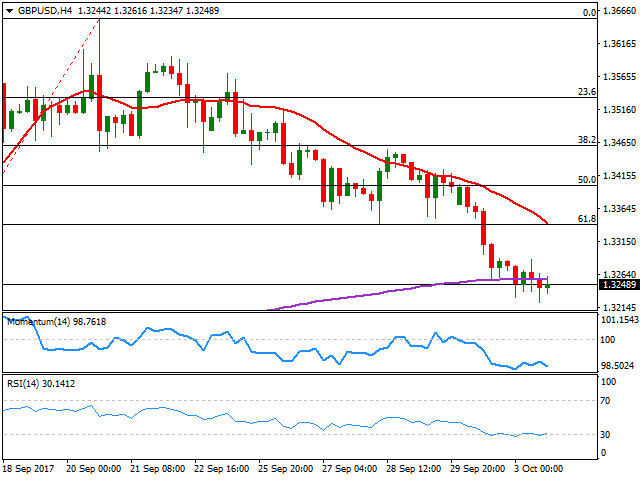
The British Pound was once again the worst performer against the greenback, amid poor UK data, with the GBP/USD pair ending the day in the red at 1.3247 after printing a daily low of 1.3221. UK’s Markit construction PMI contracted for the first time since the immediate aftermath of the Brexit referendum, down to 48.1 in September from 51.1 in August. According to the report, the drop was attributed to fragile confidence and subdued risk appetite among clients, especially in the commercial building sector. Another factor weighing on Pound these days is the lack of progress in Brexit negotiations as the clock keeps ticking towards the divorce. At this point, the pair has trimmed pretty much all of the post-BOE’s September meeting gains, when the Central Bank offered an unexpected hawkish rhetoric towards rate hikes, although a hike is still on the table. Technically, the bearish momentum decelerated according to readings in the 4 hours chart, but the downward risk persists, as indicators are consolidating within overbought territory, whilst the 20 SMA extended its decline above the current level, now converging with the 61.8% retracement of the latest bullish run, at 1.3340. A break below the mentioned daily low, will likely result in a full retracement, with the pair falling down to 1.3146, September 14th low.
Support levels: 1.3220 1.3185 1.3145
Resistance levels: 1.3300 1.3340 1.3385
GOLD
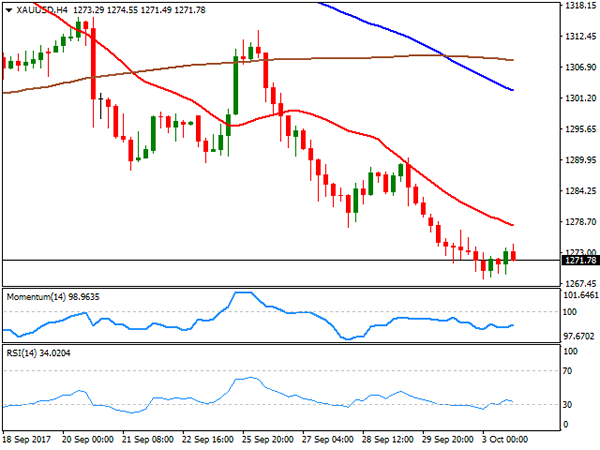
Spot gold closed the day pretty much unchanged at $1,271.75 a troy ounce, confined to a tight range all through the day. The yellow metal, however, extended its decline intraday towards 1,268.28, its lowest since mid August, indicating that bears remain in the driver seat. Expectations that the US Federal Reserve will raise rates next December have kept the commodity under pressure ever since the early September meeting, and unless the market changes its mind over the event, gold has little chances of recovering ground. From a technical point of view, the daily chart shows that an early advance was contained by selling interest around the 100 DMA, currently at 1.274.50, whilst the RSI indicator extended its downward slope, now nearing oversold territory at 35, and the Momentum stands flat well into negative territory, all of which favors another leg lower ahead. As commented on previous updates, a key support comes now at the 200 DMA, currently at 1,261.40. In the 4 hours chart, the technical outlook is also negative, as the price stands below a bearish 20 SMA, whilst technical indicators hover near oversold readings, with no aims of turning higher.
Support levels: 1,268.30 1,261.40 1,252.90
Resistance levels: 1,283.10 1.294.25 1,303.95
WTI CRUDE OIL
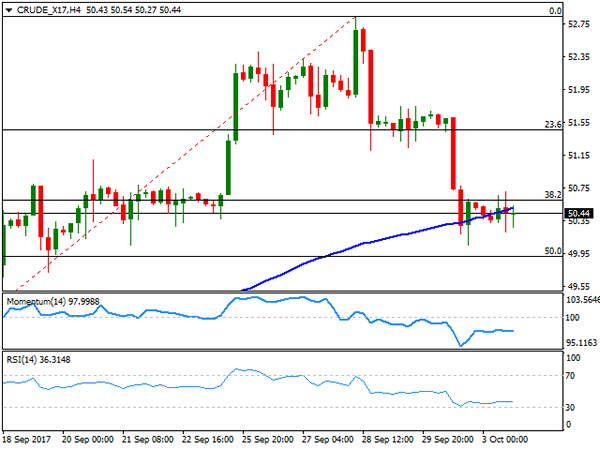
West Texas Intermediate crude oil price ended the day at $50.40 a troy ounce, little changed from its previous close. The commodity held in a limited range this Tuesday, although not far from Monday’s low, as the dollar maintained its strength across the board, whilst there were no fresh news for the oil market. Ahead of the API and the more relevant EIA US stockpiles report, the commodity seems poised to extend its decline, according to technical readings in the daily chart, as it held below a key Fibonacci resistance, the 38.2% retracement of the latest bullish run at 50.60, still the immediate resistance. In the same chart, technical indicators keep grinding lower, now about to enter negative territory, although the price remains well above its long-term moving averages. In the 4 hours chart, WTI is biased lower, as it´s now standing below its 100 SMA, whilst technical indicators gain downward strength within negative territory. The immediate support comes at 49.90, the 50% retracement of the mentioned rally, with a break below it opening doors for a continued decline this Wednesday.
Support levels: 49.90 49.30 48.65
Resistance levels: 50.60 51.20 51.85
DJIA
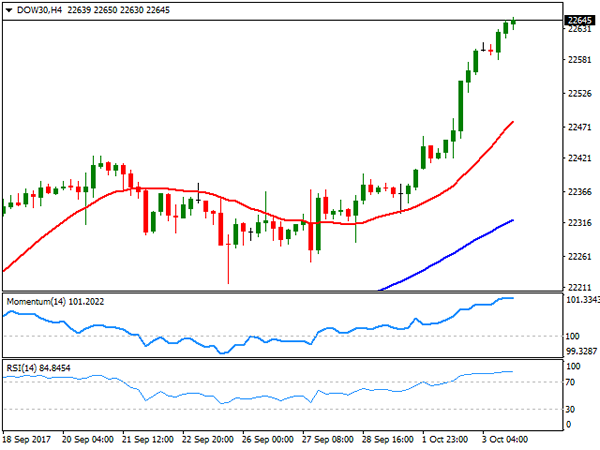
US indexes closed at record highs this Tuesday, backed by latest US upbeat data, and a rally in airlines-related equities. The Dow Jones Industrial Average gained 84 points, to end at 22,641.67, the Nasdaq Composite added 15 points to 6,531.71, while the S&P closed at 2,534.58, up by 0.22%. US stocks extended their positive Monday momentum, triggered by a better-than-expected ISM manufacturing PMI, which indicated solid economic growth. Within the Dow, Wal-Mart led advancers, up 1.08%, followed by American Express which added 0.99%. Only six members were down, led by Nike that shed 0.80%. The DJIA is up for a fifth consecutive day, up for over 15% so far this year, and clearly overbought according to long-term technical readings, but offering no signs of changing course. However, as higher it moves, the higher will be the risk of a sudden downward correction. In the daily chart, technical indicators head sharply higher, with the RSI currently at 78, and with moving averages accelerating north below the current level. Shorter term, the index is also bullish and extremely overbought, with the RSI indicator currently heading north around 85, the Momentum also aiming higher, and the 20 SMA gaining further upward strength below the current level, currently at 22,481, in line with the longer term perspective.
Support levels: 22,617 22,581 22,557
Resistance levels: 22,660 22,700 22,740
FTSE100
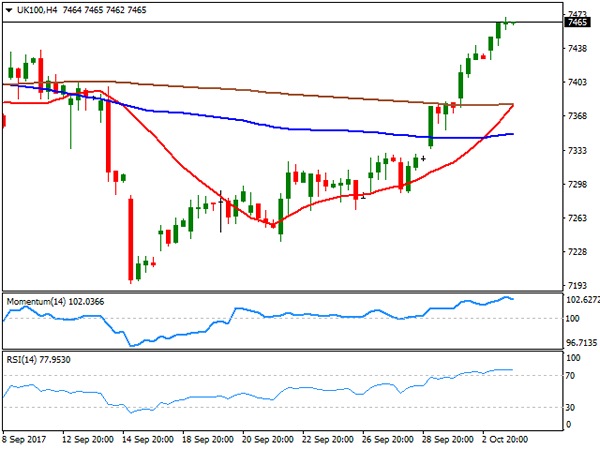
The FTSE 100 advanced 29 points to 7,468.11 this Tuesday, helped by continued Pound weakness. Plumbing supplies group Ferguson was the best performer, up 4.03%, as the company reported an 8.6% raise in annual revenues at its ongoing businesses, with trading profit up 8.7% to £1.03bn. Ashtead Group followed, up by 3.29%. Leading losers was Admiral Group that lost 2.73%, followed by WPP that lost 2.08% after Morgan Stanley sold 22.5 million shares. The Footsie closed at its highest in nearly two months, maintaining the positive momentum in its daily chart, as the index advanced further above its 20 and 100 SMAs, while technical indicators accelerated higher within bullish territory. Shorter term and according to the 4 hours chart, the index settled near its daily high and with moving averages supporting additional gains, as the 20 SMA is about to surpass the 200 SMA after breaking through the 100 SMA, but technical indicators are giving some signs of upward exhaustion in overbought territory, suggesting a downward corrective movement is possible this Wednesday.
Support levels : 7,444 7,408 7,371
Resistance levels: 7,466 7,495 7,535
DAX
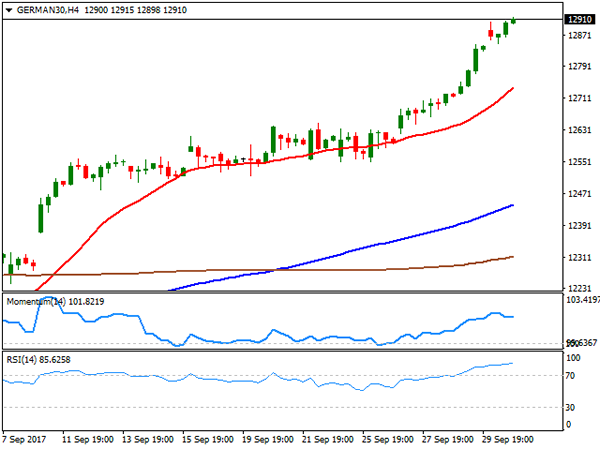
European equities gained this Tuesday, although there was no action in the DAX, as Germany had a bank holiday due to the Day of German Unity, with the latest registered close for the index at 12,902.65. Equities in the region were supported by gains in the retail sector, but political concerns may hit European indexes this Wednesday, as tensions within Spain are still a key issue for the region, given that the central government in to will to give its arm to turn, while the Catalonia region prepares to declare its independence. As commented on the previous update, the index is not far from its intraday record high of 12,953, and technical readings in the daily chart favor additional gains ahead, given that technical indicators maintain their upward strength, with the RSI indicator currently at 76, while the index moves further above bullish moving averages. In the 4 hours chart, technical readings also support a new leg higher, as the 20 SMA accelerated north below the current level, whilst technical indicators have turned flat after the close, within extreme overbought readings.
Support levels: 12,796 12,752 12,710
Resistance levels: 12,847 12,881 12,933