
Hello fellow traders. In this technical blog we’re going to take a quick look at the Elliott Wave charts of NASDAQ . As our members know, the Index shows bearish sequences in the cycle from the November 22. 2021 peak. Incomplete structure calls for a further decline. Recently Nasdaq has made 3 waves bounce , when it has reached our selling zone. We recommended members to avoid buying and keep selling rallies in 3,7,11 swings due to bearish sequences. In the further text we are going to explain the Elliott Wave Forecast and the trading strategy.
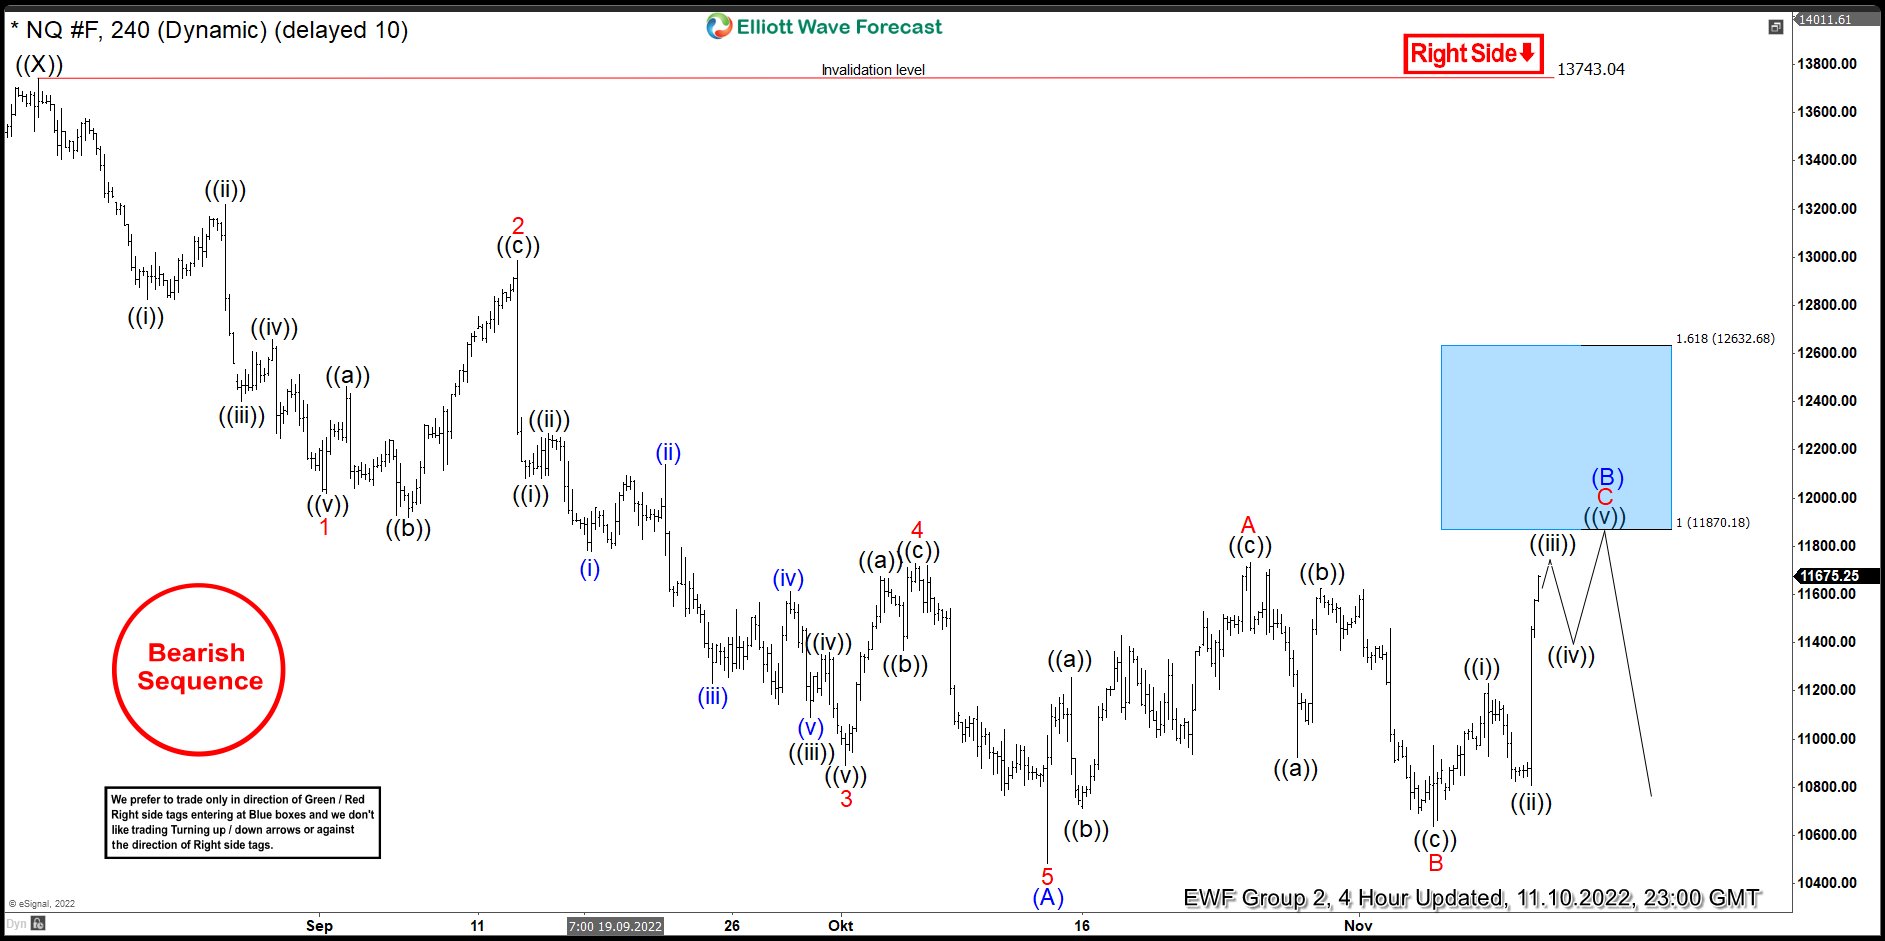
Nasdaq H4 Elliott Wave Analysis 11.10.2022
Nasdaq is giving us bounce that is correcting the cycle from the 13743.04 peak. At this moment we believe recovery is still in progress as the price shows incomplete sequences. Consequently we are calling for more short term strength toward 11870.18-12632.68 area to complete (B) blue . We recommended members to avoid buying the Index in proposed push up. Strategy is waiting for Blue Box to be reached before selling it. As the main trend is bearish we expect sellers to appear at the blue box for 3 waves pull back at least. Once pull back reaches 50 Fibs against the B red low, we will make short position risk free ( put SL at BE) and take partial profits. Invalidation for the trade would be break above 1.618 fibs extension: 12632.68
As our members know Blue Boxes are no enemy areas , giving us 85% chance to get a reaction.
Reminder:
Our charts are easy to trade and understand. When you see combination of right side stamp and blue box on the chart, the instrument can be traded. Quick explanation :
-Red bearish stamp+ blue box = Potential Selling Setup
-Green bullish stamp+ blue box = Potential Buying Setup
-Charts with Black stamps are not tradable. 🚫
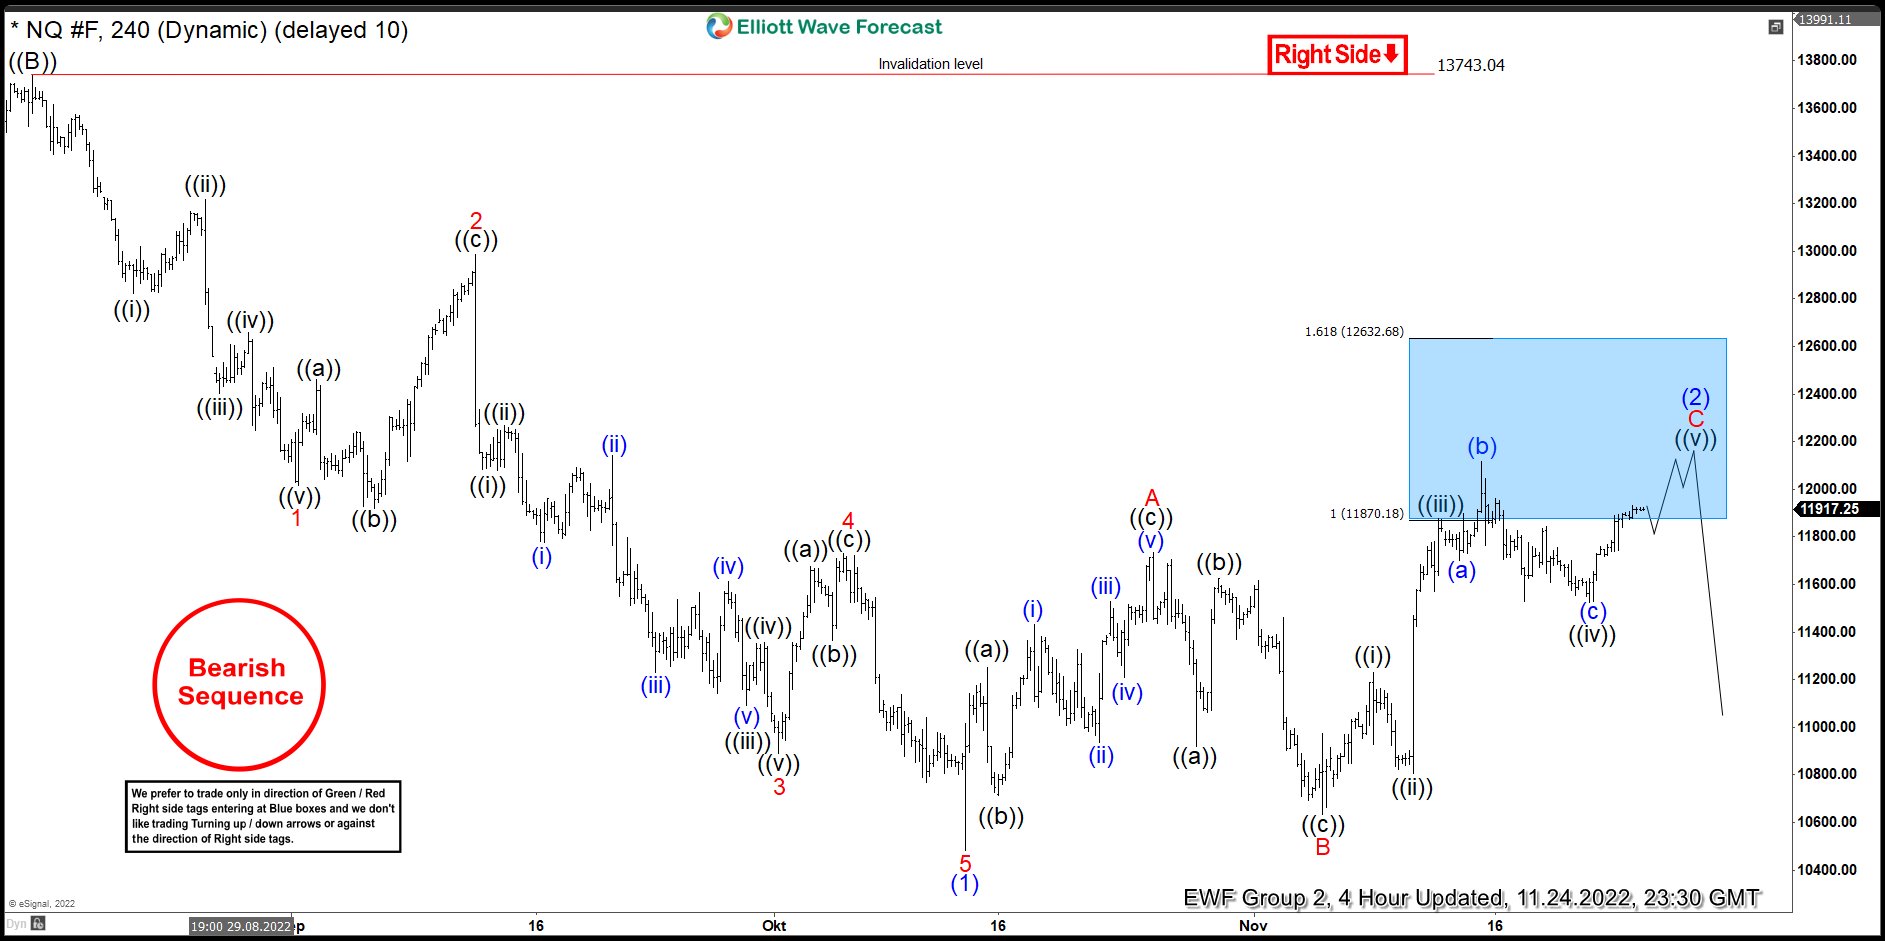
Nasdaq H4 Elliott Wave Analysis 11.24.2022
Nasdaq reached equal legs ( blue box ) area at 11870.18-12632.68 and made turn lower from there. We already got a reaction from the blue box. However we still believe another marginal push up within the blue box would be ideal to complete recovery.
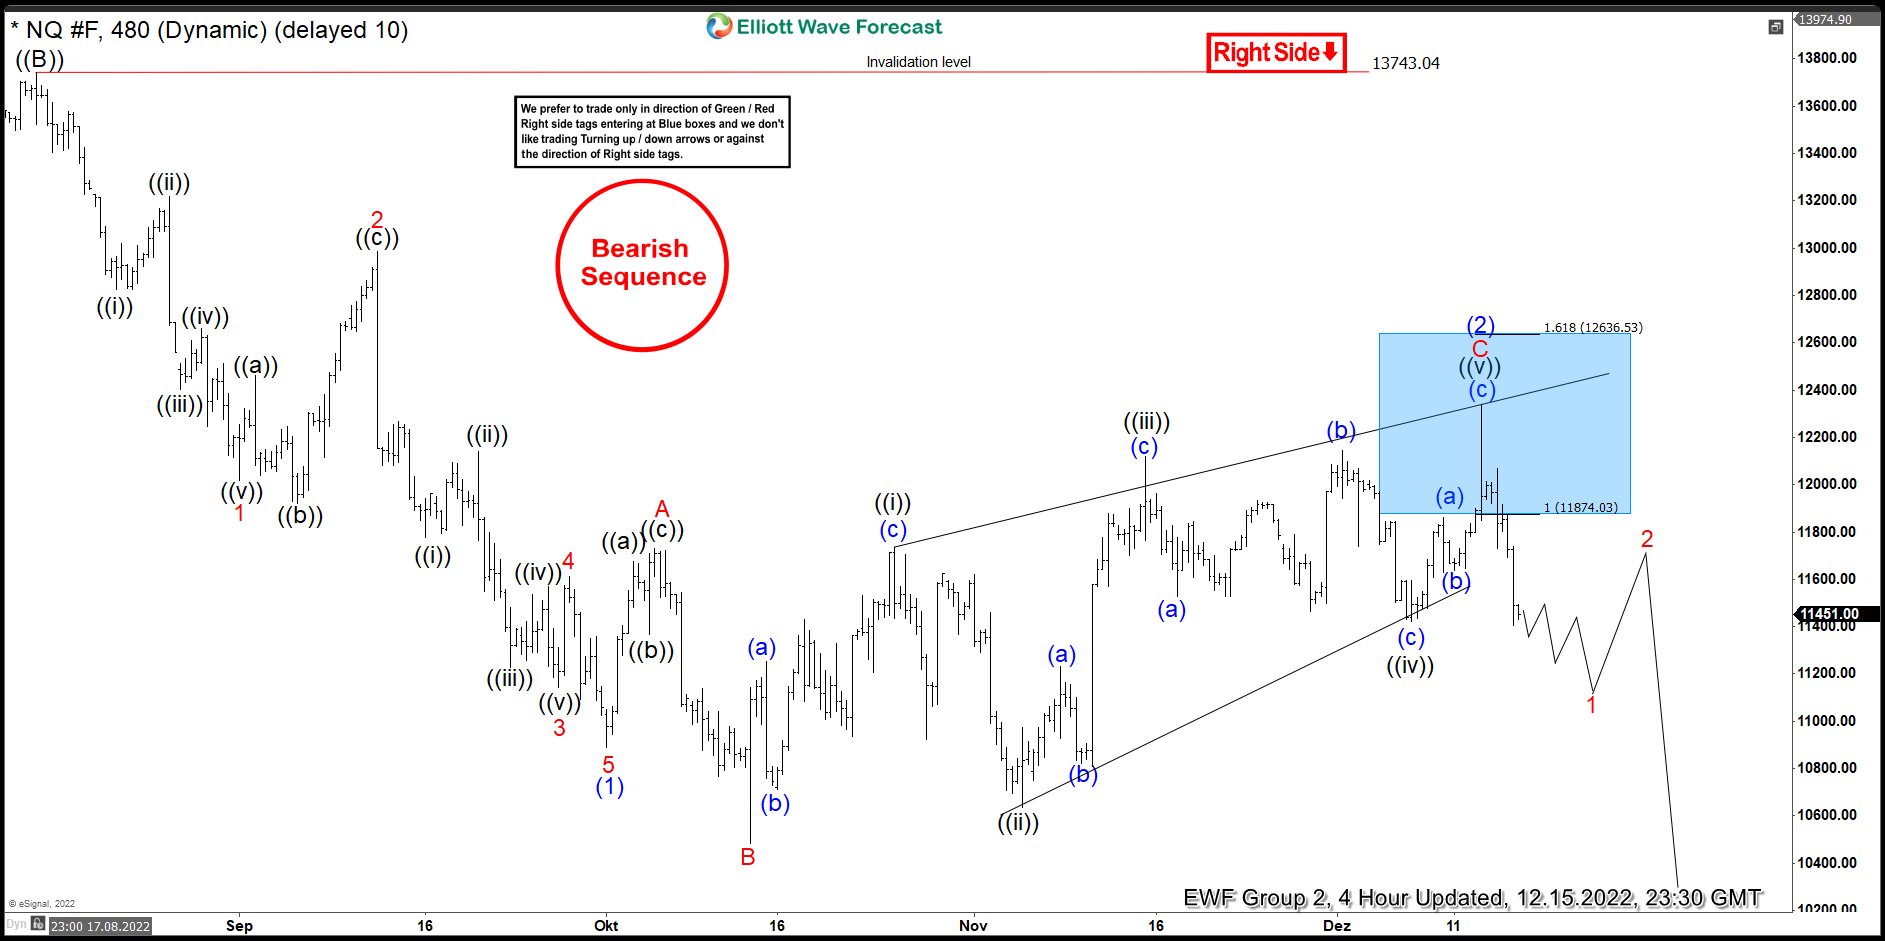
Nasdaq H4 Elliott Wave Analysis 11.24.2022
Eventually the index has made last push up and found sellers as expected. We have got decent reaction from the blue box that has reached and exceeded 50 fibs against the connector. As a result , members who took short trades made positions risk free ( Put SL at BE) and took partial profits. At this stage we call wave (2) blue connector completed at 12332 .6high. We would like to see break of 10/13 low to confirm next leg down is in progress.


