
In this technical blog we’re going to take a quick look at the Elliott Wave charts of ETHUSD . As our members know ETH is showing incomplete sequences in the cycle from the 08/15 peak. The cryptocurrency is bearish against the 1681.4 pivot. Recently ETH has made 3 waves bounce , when it has reached our blue box- selling zone. We recommended members to avoid buying and keep selling rallies in 3,7,11 swings due to bearish sequences. In the further text we are going to explain the Elliott Wave Forecast and the trading strategy.
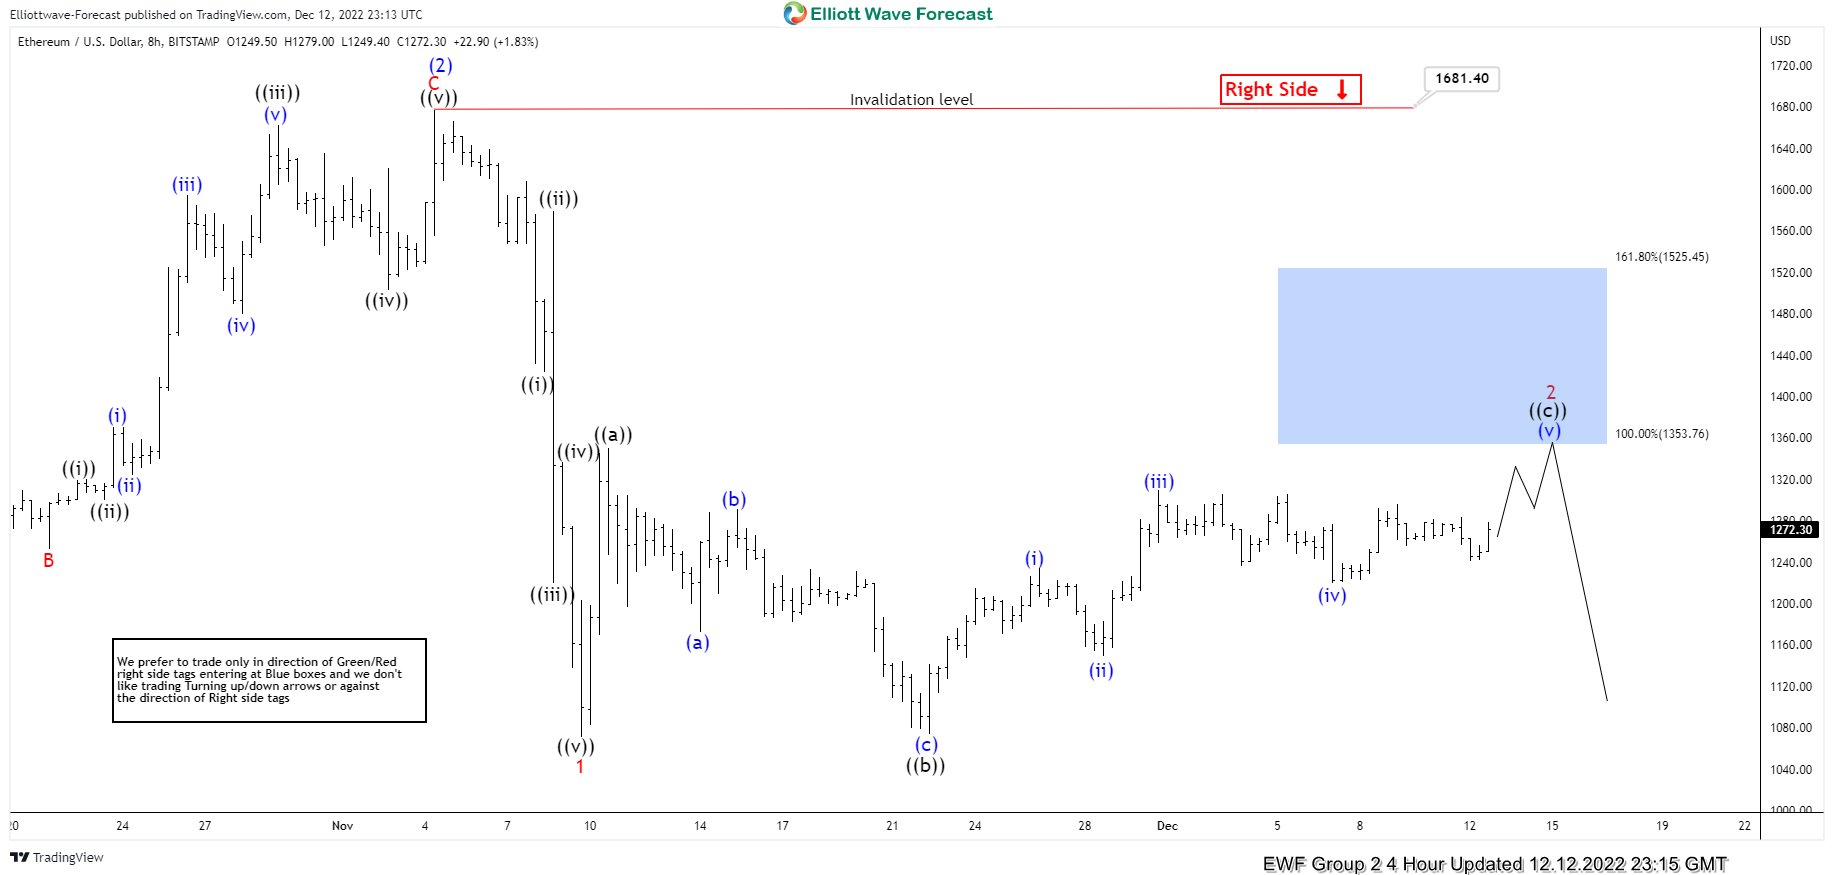
ETHUSD H4 Elliott Wave Analysis 12.12.2022
ETHUSD made 5 waves down from the 1681.4 high. Currently the price is giving us 2 red recovery that is correcting the cycle from the mentioned 1681.4 peak. At this moment we believe recovery is still in progress toward marked blue box area. We recommended members to avoid buying the Index in proposed push up.
ETHUSDLet’s see what the price structure looks like in h1 time frame.
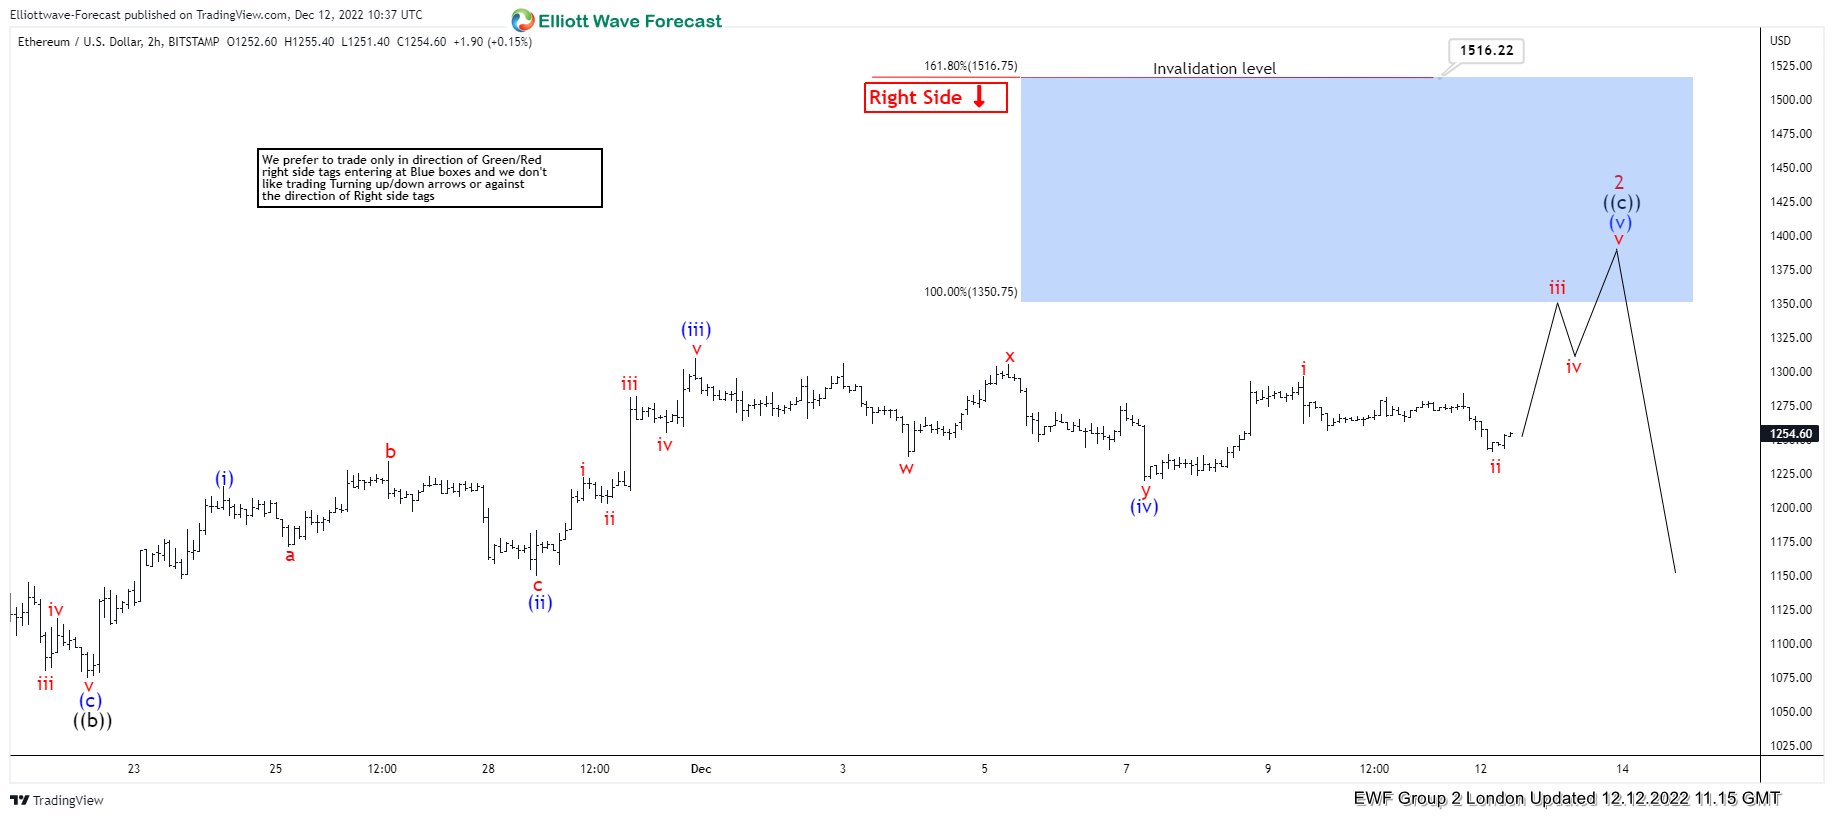
ETHUSD H1 Elliott Wave Analysis 12.12.2022
Correction looks incomplete at the moment. We expect to see more more upside toward 1350.7-1516.75 area. Strategy is waiting for Blue Box to be reached before selling it. Invalidation for the trade would be break above 1.618 fibs extension: 1516.22. As the main trend is bearish we expect sellers to appear at the blue box for 3 waves pull back at least. Once pull back reaches 50 Fibs against the ((b)) black low, we will make short position risk free ( put SL at BE) and take partial profits.
As our members know Blue Boxes are no enemy areas , giving us 85% chance to get a reaction.
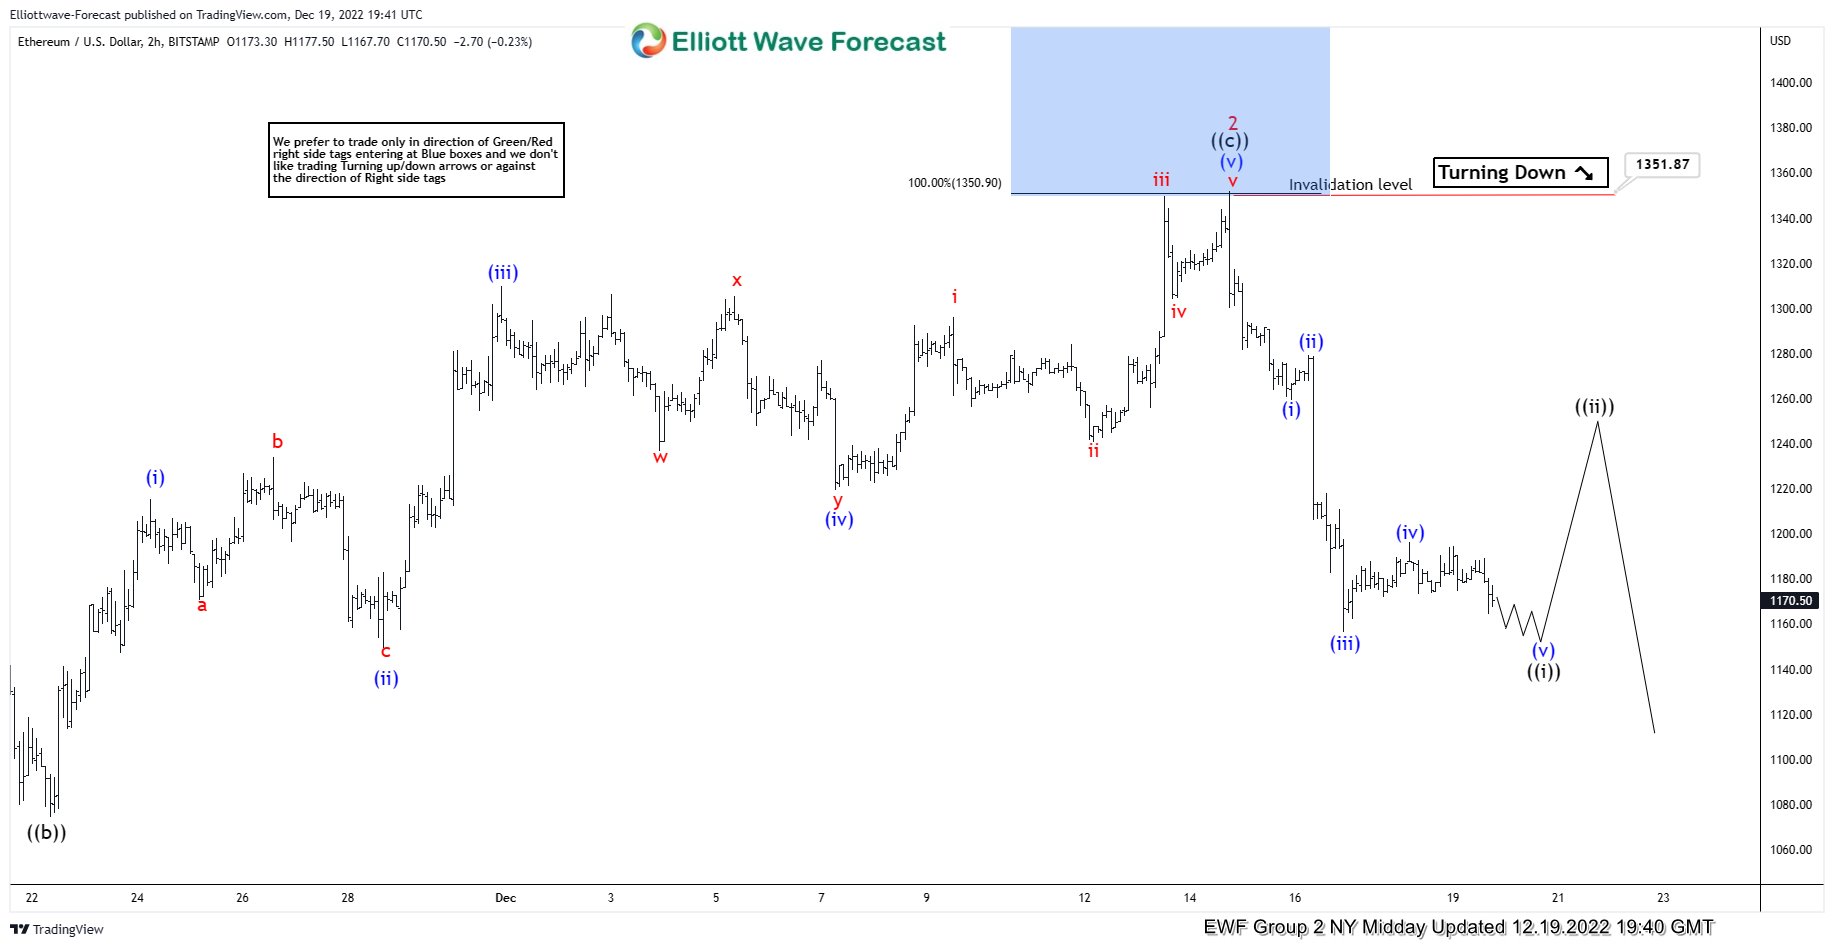
ETHUSD H1 Elliott Wave Analysis 12.19.2022
Eventually , ETHUSD made extension higher toward our selling zone : 1350.7-1516.75 area. The pair found sellers right at the blue box and made reaction from there that has reached 50 fibs against the ((b)) black low. As a result, members who took short trades mad positions risk free . ( Put SL at BE) and took partial profits. At this stage we see wave 2 red completed at 1351.87 high. Decline from the peak looks to be unfolding as 5 waves. We expect another marginal low before bounce in ((ii)) takes place. The price should ideally make break of previous low : 3 red 11/09 to confirm wave 3 red is in progress.
Keep in mind market is dynamic and presented view could have changed in the mean time. You can check most recent charts in the membership area of the site. Best instruments to trade are those having incomplete bullish or bearish swings sequences.We put them in Sequence Report and best among them are shown in the Live Trading Room.


