
The DXY index chart shows the end of the global corrective trend, which took the form of a triple zigzag consisting of five main cycle waves w-x-y-x-z.
Thus, the market may currently be at the beginning of the first part of a major bearish trend.
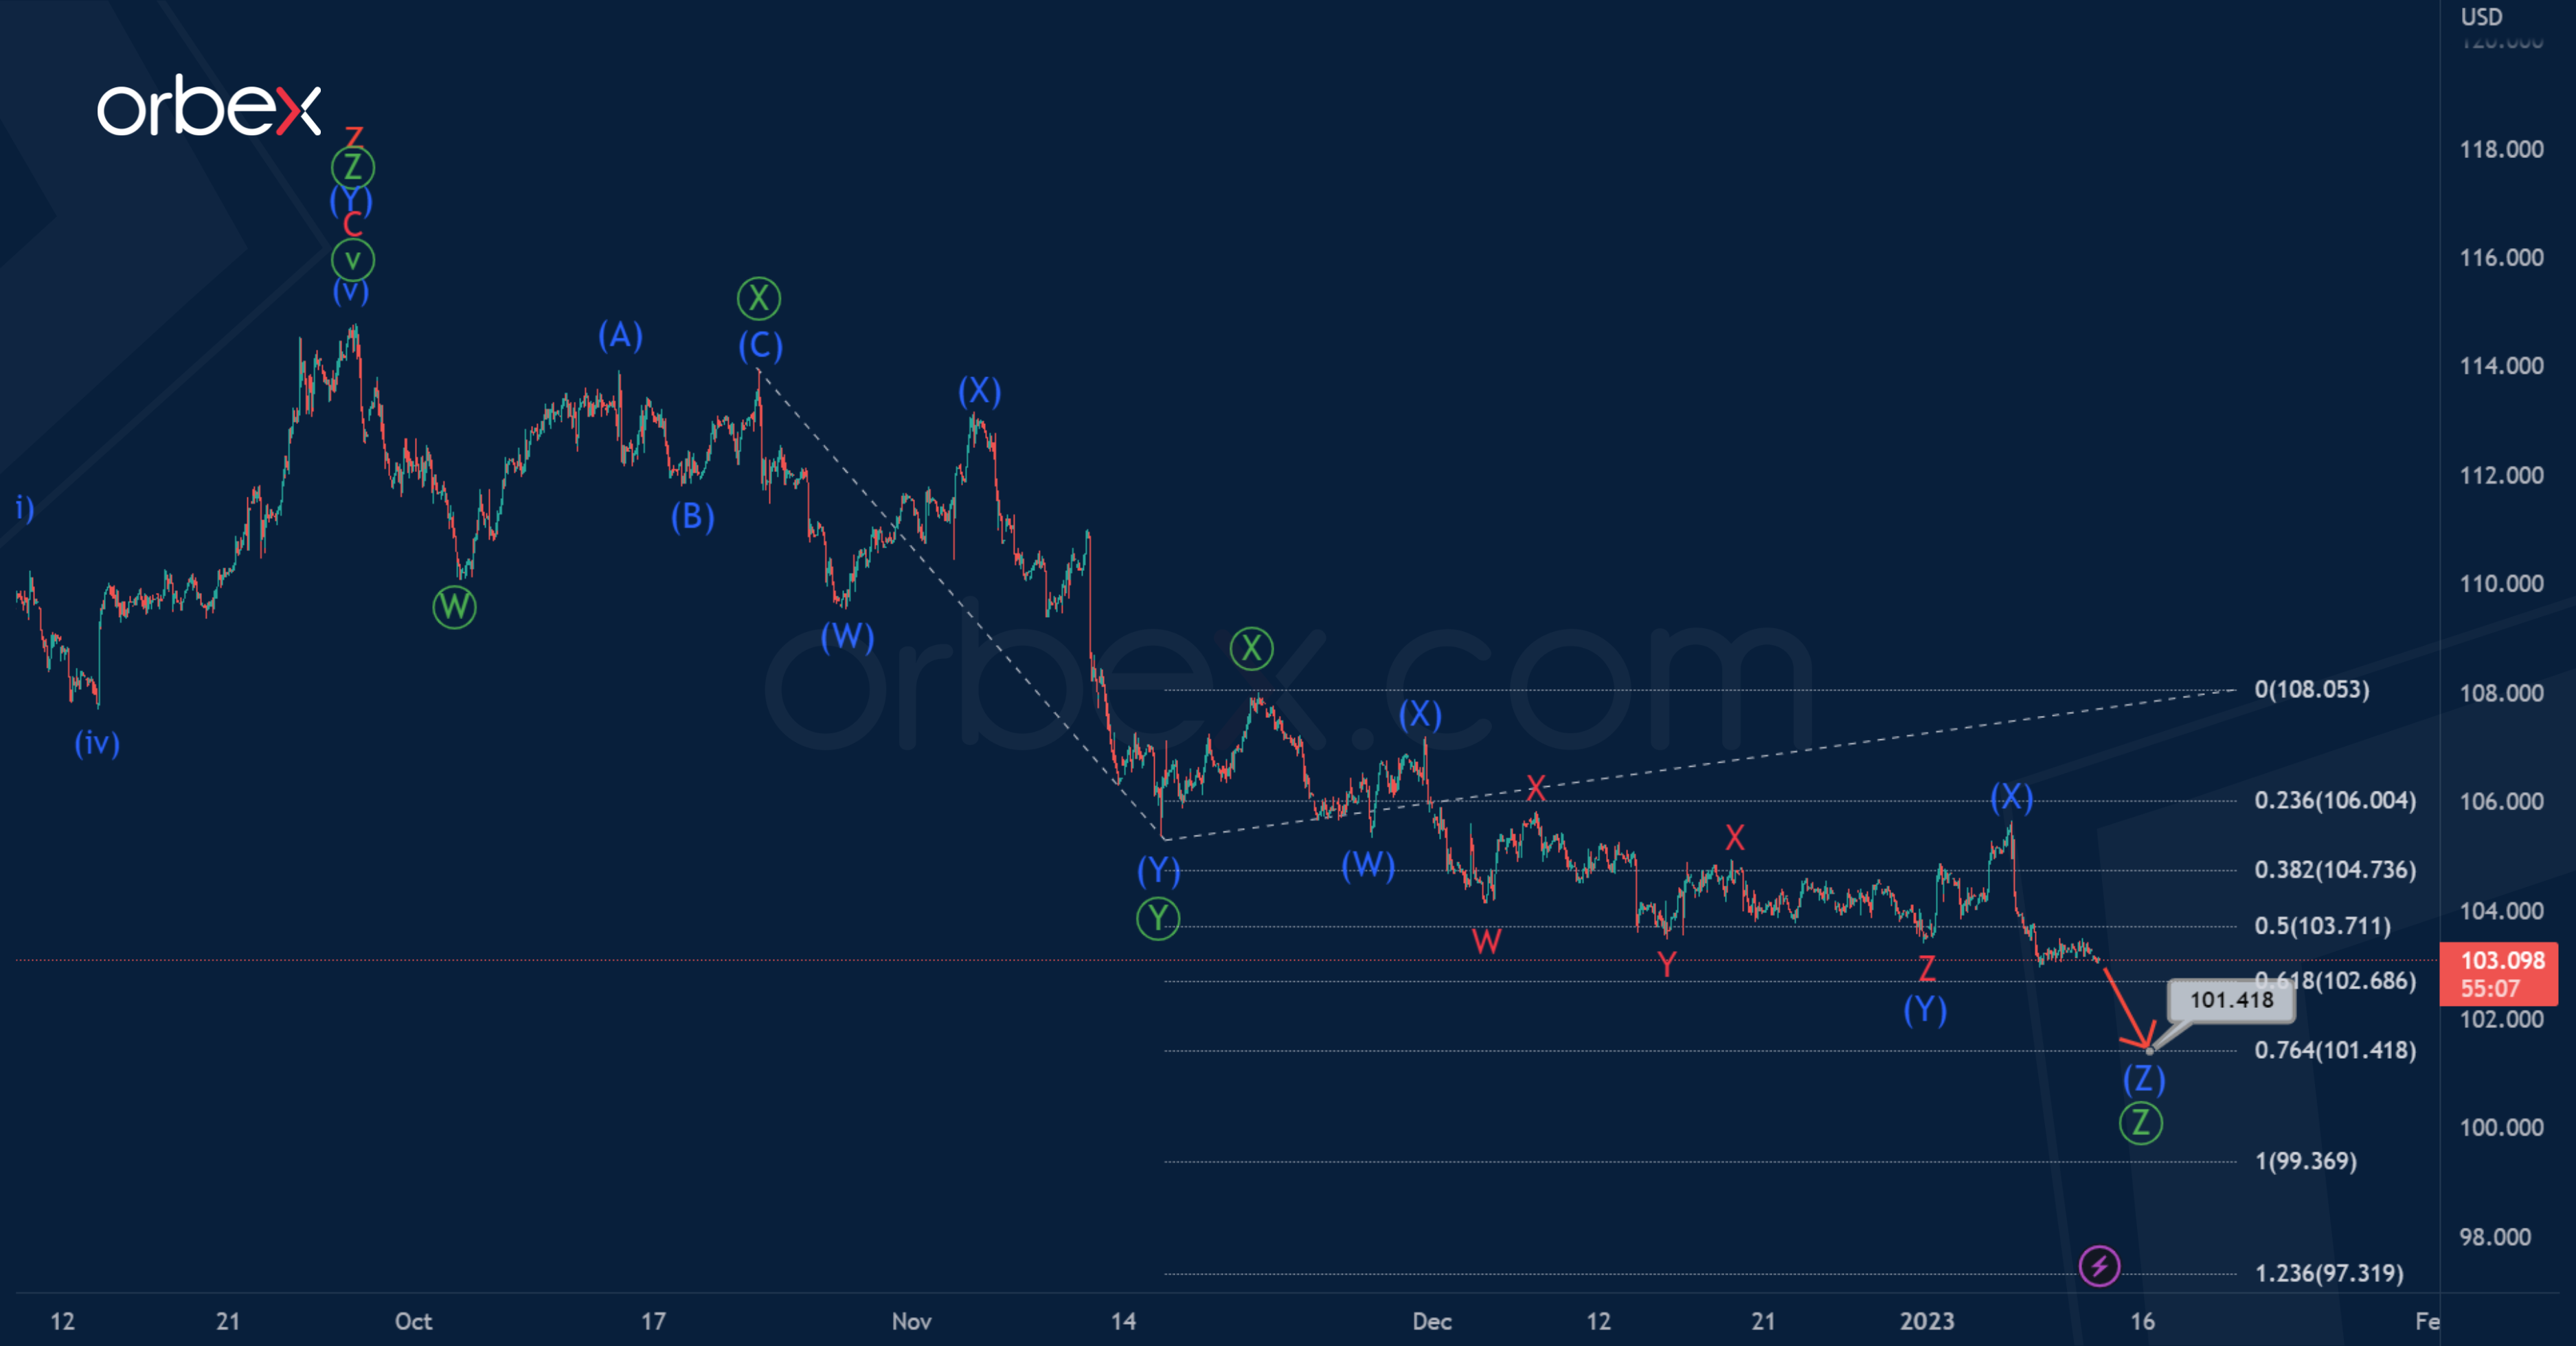
It is assumed that the bears form a triple zigzag pattern Ⓦ-Ⓧ-Ⓨ-Ⓧ-Ⓩ. It seems that the sub-waves Ⓦ-Ⓧ-Ⓨ-Ⓧ have already been completed. In the near future, the price is expected to continue falling in the primary wave Ⓩ. Its end is possible near 101.41. At that level, it will be at 76.4% of wave Ⓨ. The wave Ⓩ itself is also similar to an intermediate triple zigzag.
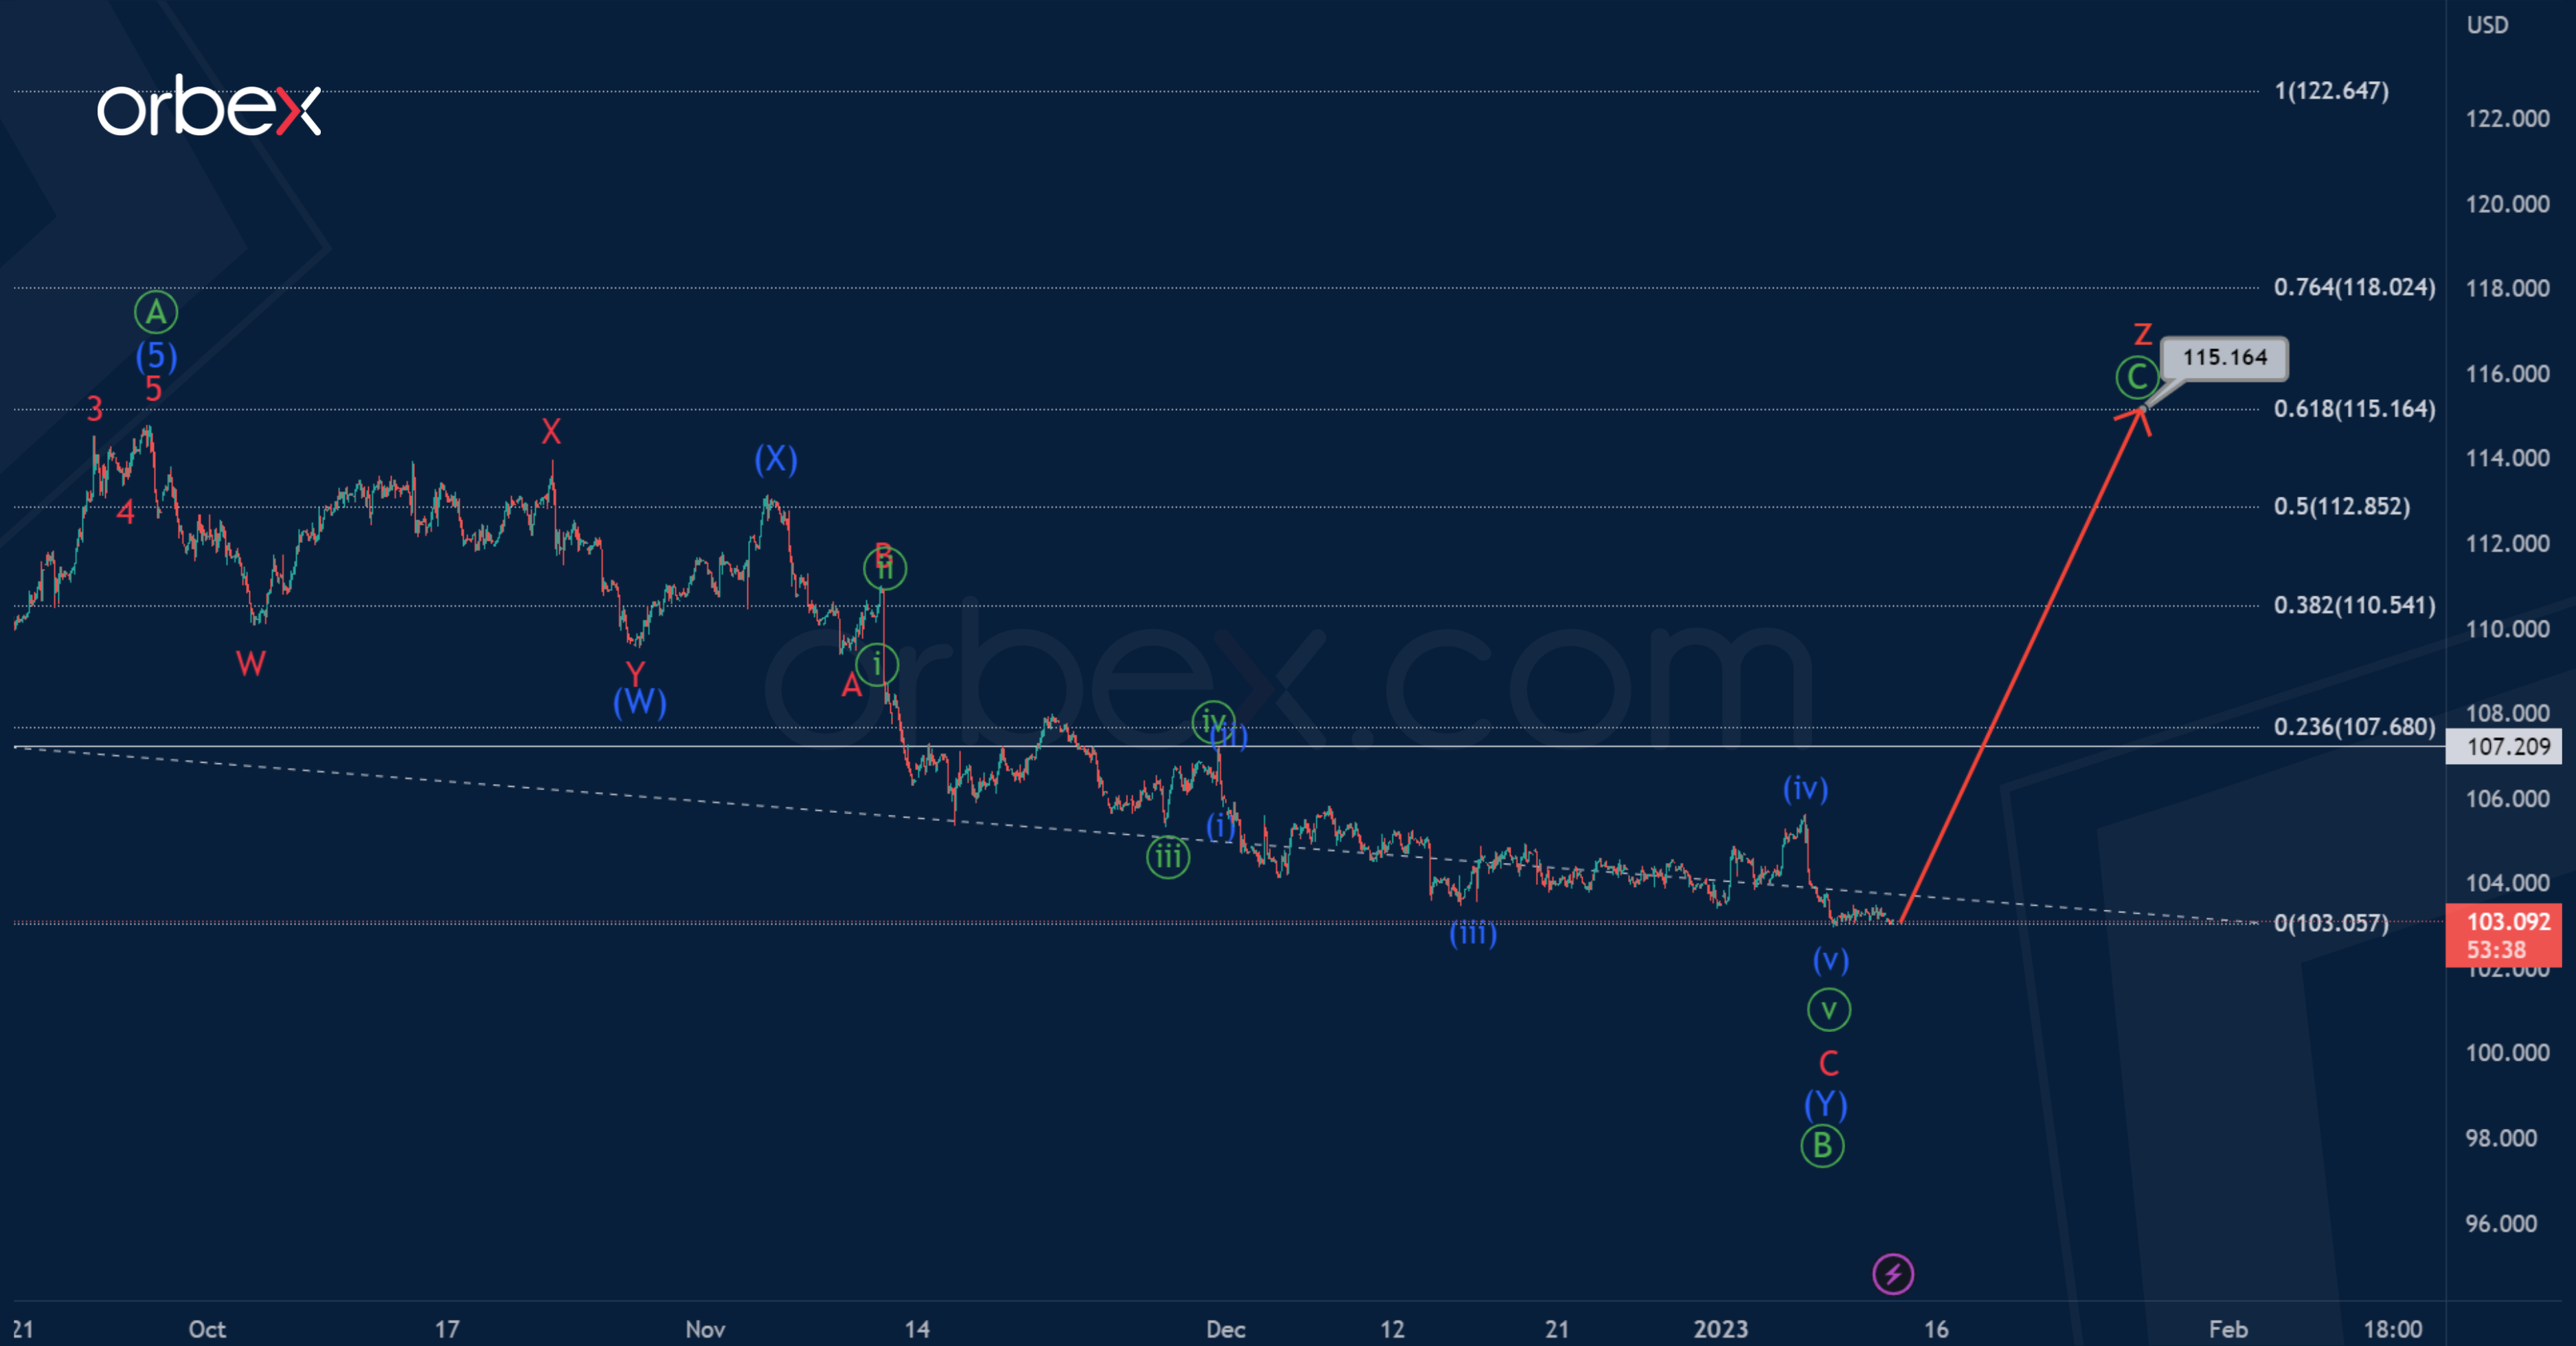
Let’s consider an alternative scenario in which the formation of a cycle triple zigzag will continue.
The wave z may take the form of a zigzag Ⓐ-Ⓑ-Ⓒ, where the first impulse Ⓐ and the correction Ⓑ in the form of an intermediate double zigzag are already completed. The entire wave z can complete its pattern near 115.16. At that level, it will be at the 61.8% Fibonacci extension of wave y.


