
Natural Gas (NG) has lost over 63% in value since the peak in August 2022. It has been a rather sharp decline with a sizeable recovery in the middle before the decline resumed again. Today, we will take a look at Elliott Wave structure of the decline from August 2022 peak, show some charts from members area to explain how we have been calling it lower for a while and now that October 24, 2022 low has been broken, what will be the next target area.
Natural Gas 4 Hour Elliott Wave Analysis – 5 December 2022
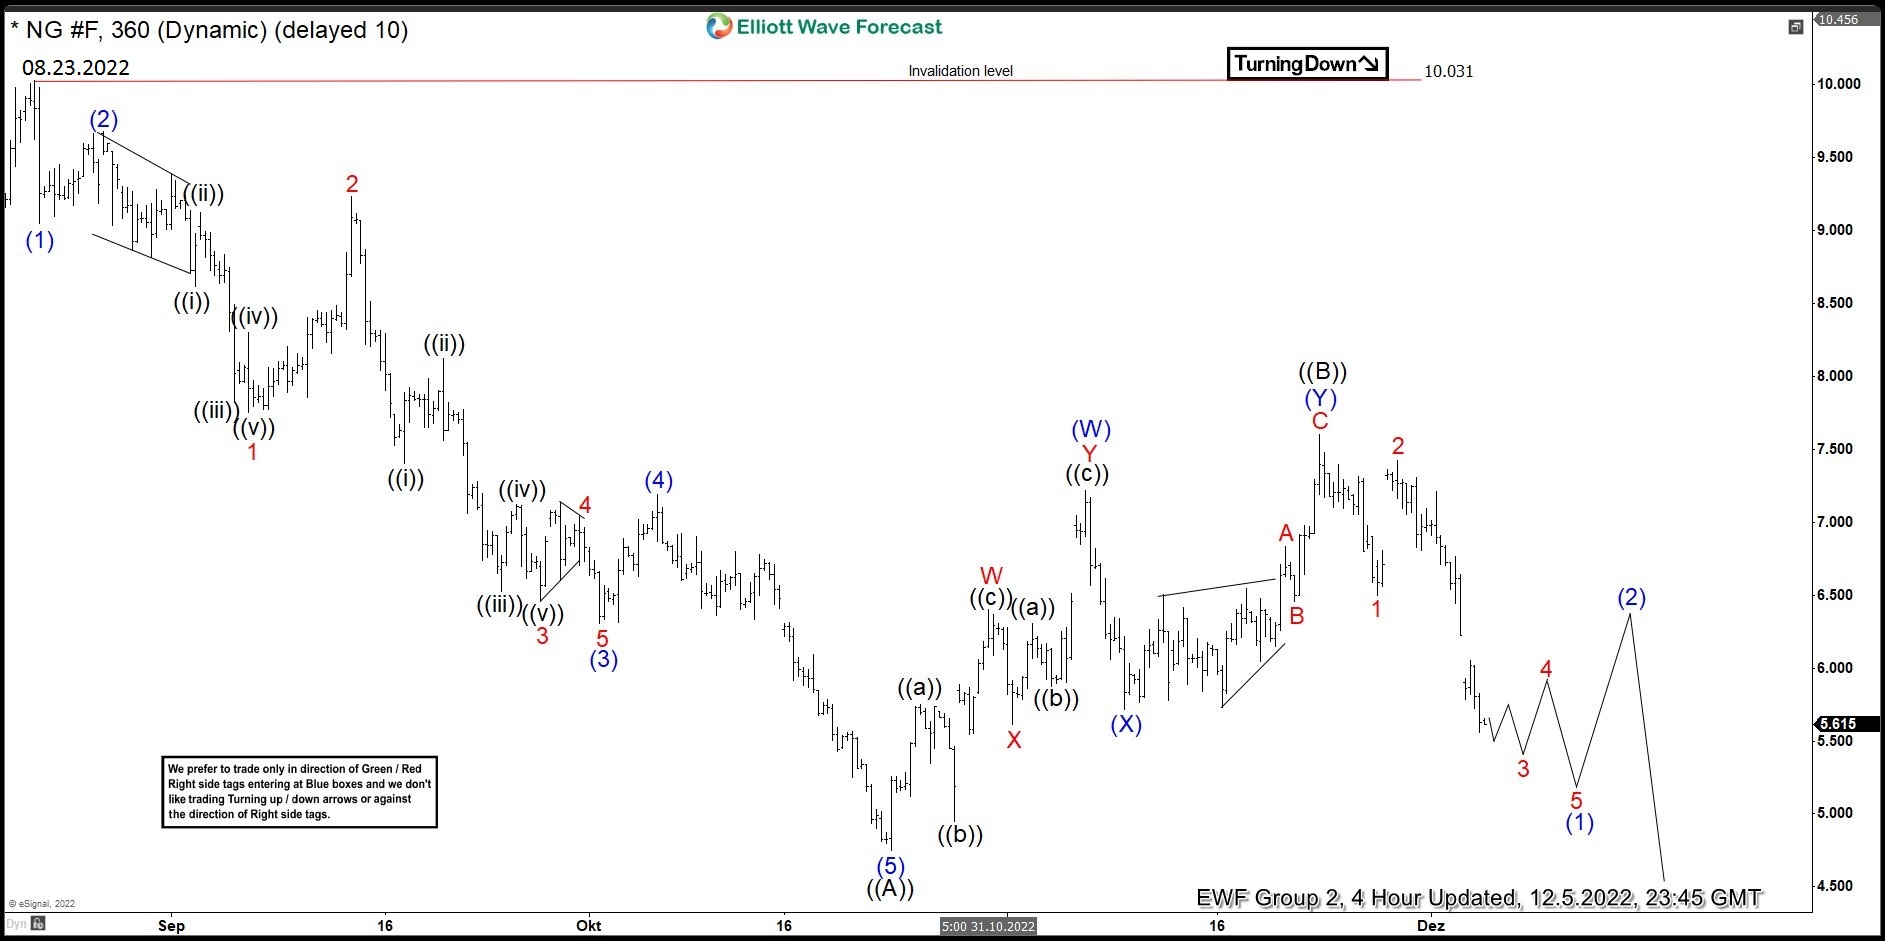
Chart below shows Natgas initial decline from 08.23.2022 peak was an Elliott Wave Impulse within which wave (1) ended at 9.05, wave (2) ended at 9.682, wave (3) ended at 6.305, wave (4) ended at 7.188 and wave (5) ended at 4.75. Since we expected this decline to be part of a correction so we labelled it wave ((A)) anticipating the correction to unfold as a Zigzag Elliott Wave structure. Impulsive decline from 08.23.2022 peak was followed by a corrective recovery to 7.604 which we labelled as wave ((B)) and then the decline resumed again. We expected some more downside to complete wave (1) before a bounce in wave (2) to fail below 7.604 high for extension lower in wave (3) of ((C)).
Natural Gas 4 Hour Elliott Wave Analysis – 11 January 2023
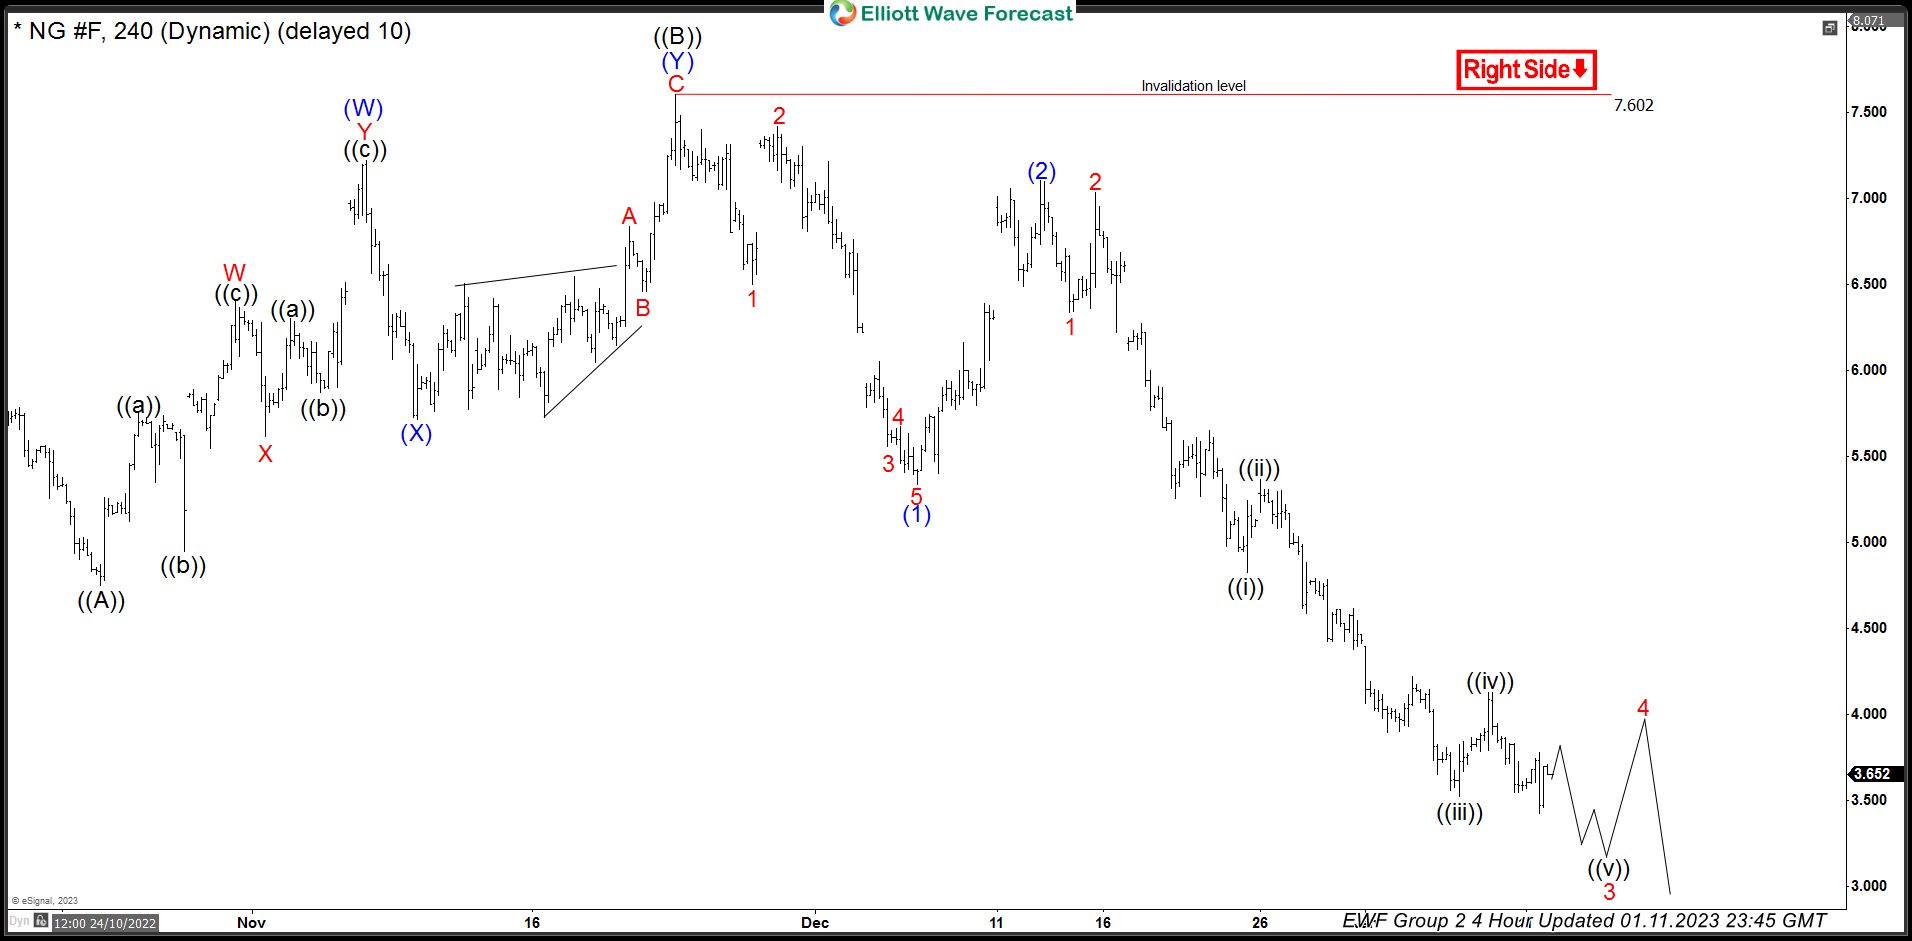
We can see wave (1) completed at 5.337, this was followed by a sharp recovery in wave (2) to 7.105 and then decline resumed. We have already seen a break of wave ((A)) low at 4.75 with price currently trading at 3.652. Chart shows that we are trading within wave 3 of (3) which has either ended at 3,422 or will see a bit more downside to complete wave 3 of (3). Once wave 3 is complete, expect a bounce in wave 4 and lower again in wave 5 of (3). Then, expect another bounce in wave (4) and another leg lower in wave (5) to complete 5 waves down in wave ((C)).
Natural Gas – Target Area
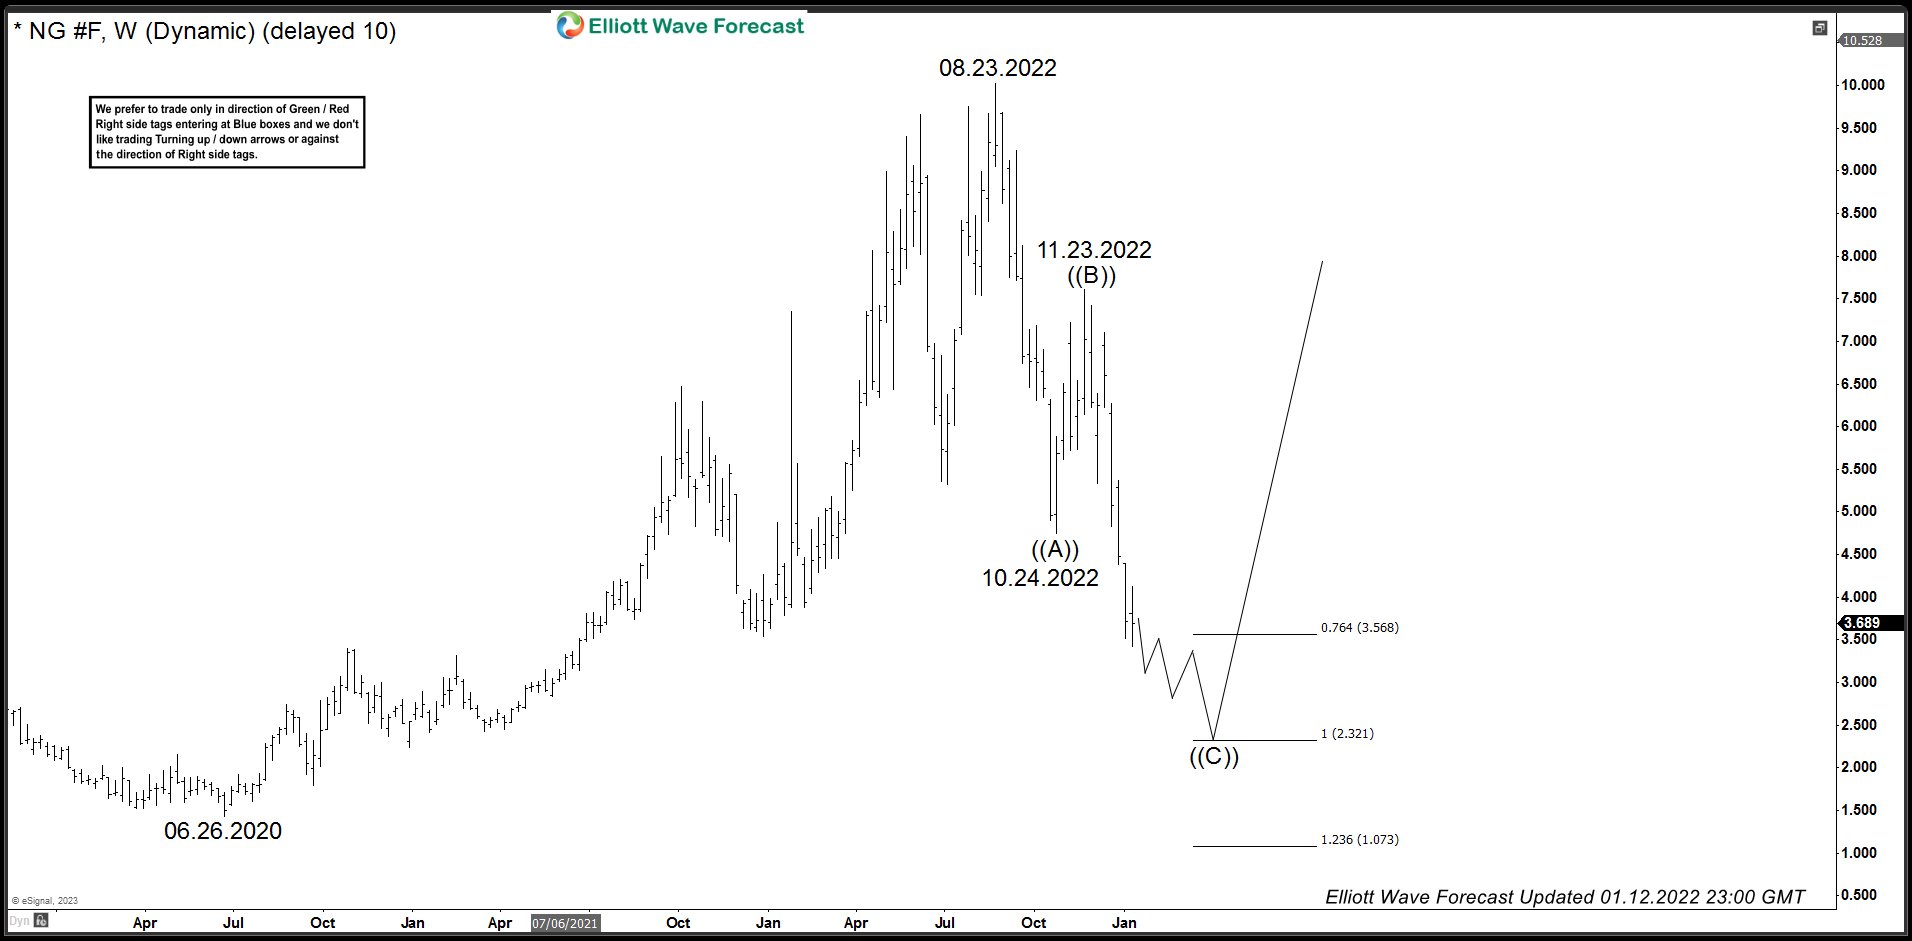
Chart below shows the target area with ideal area between 2.321 – 1.073 which is 100 – 123.6% Fibonacci extension of the first leg down from 08.23.2022 peak to 10.24.2022 low projected lower from 11.23.2022 peak. This is where buyers should be entering the market and then resume the rally for a new high above 08.23.2022 peak or produce a larger 3 waves bounce at least.


