
Hello fellow traders. In this technical article we’re going to take a look at the Elliott Wave charts charts of NZDUSD published in members area of the website. As our members know NZDUSD has recently made recovery against the 0.6538 peak that has unfolded as Elliott Wave Double Three Pattern. It made clear 7 swings from the lows and completed correction at the extreme zone. In further text we’re going to explain the Elliott Wave pattern and forecast
Before we take a look at the real market example, let’s explain Elliott Wave Double Three pattern.
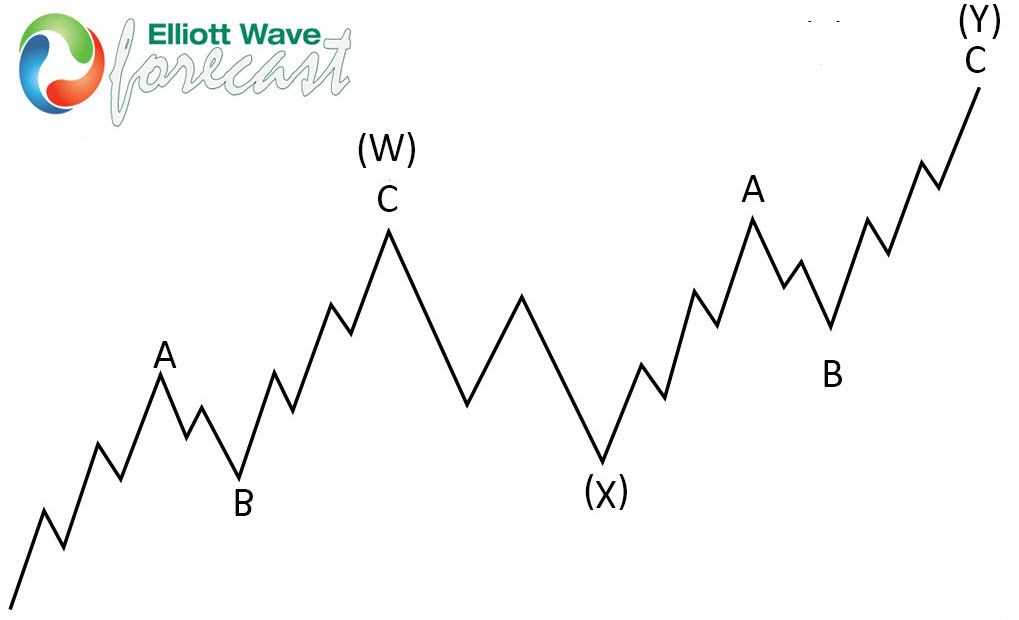
Elliott Wave Double Three Pattern
Double three is the common pattern in the market , also known as 7 swing structure. It’s a reliable pattern which is giving us good trading entries with clearly defined invalidation levels.
The picture below presents what Elliott Wave Double Three pattern looks like. It has (W),(X),(Y) labeling and 3,3,3 inner structure, which means all of these 3 legs are corrective sequences. Each (W) and (Y) are made of 3 swings , they’re having A,B,C structure in lower degree, or alternatively they can have W,X,Y labeling.
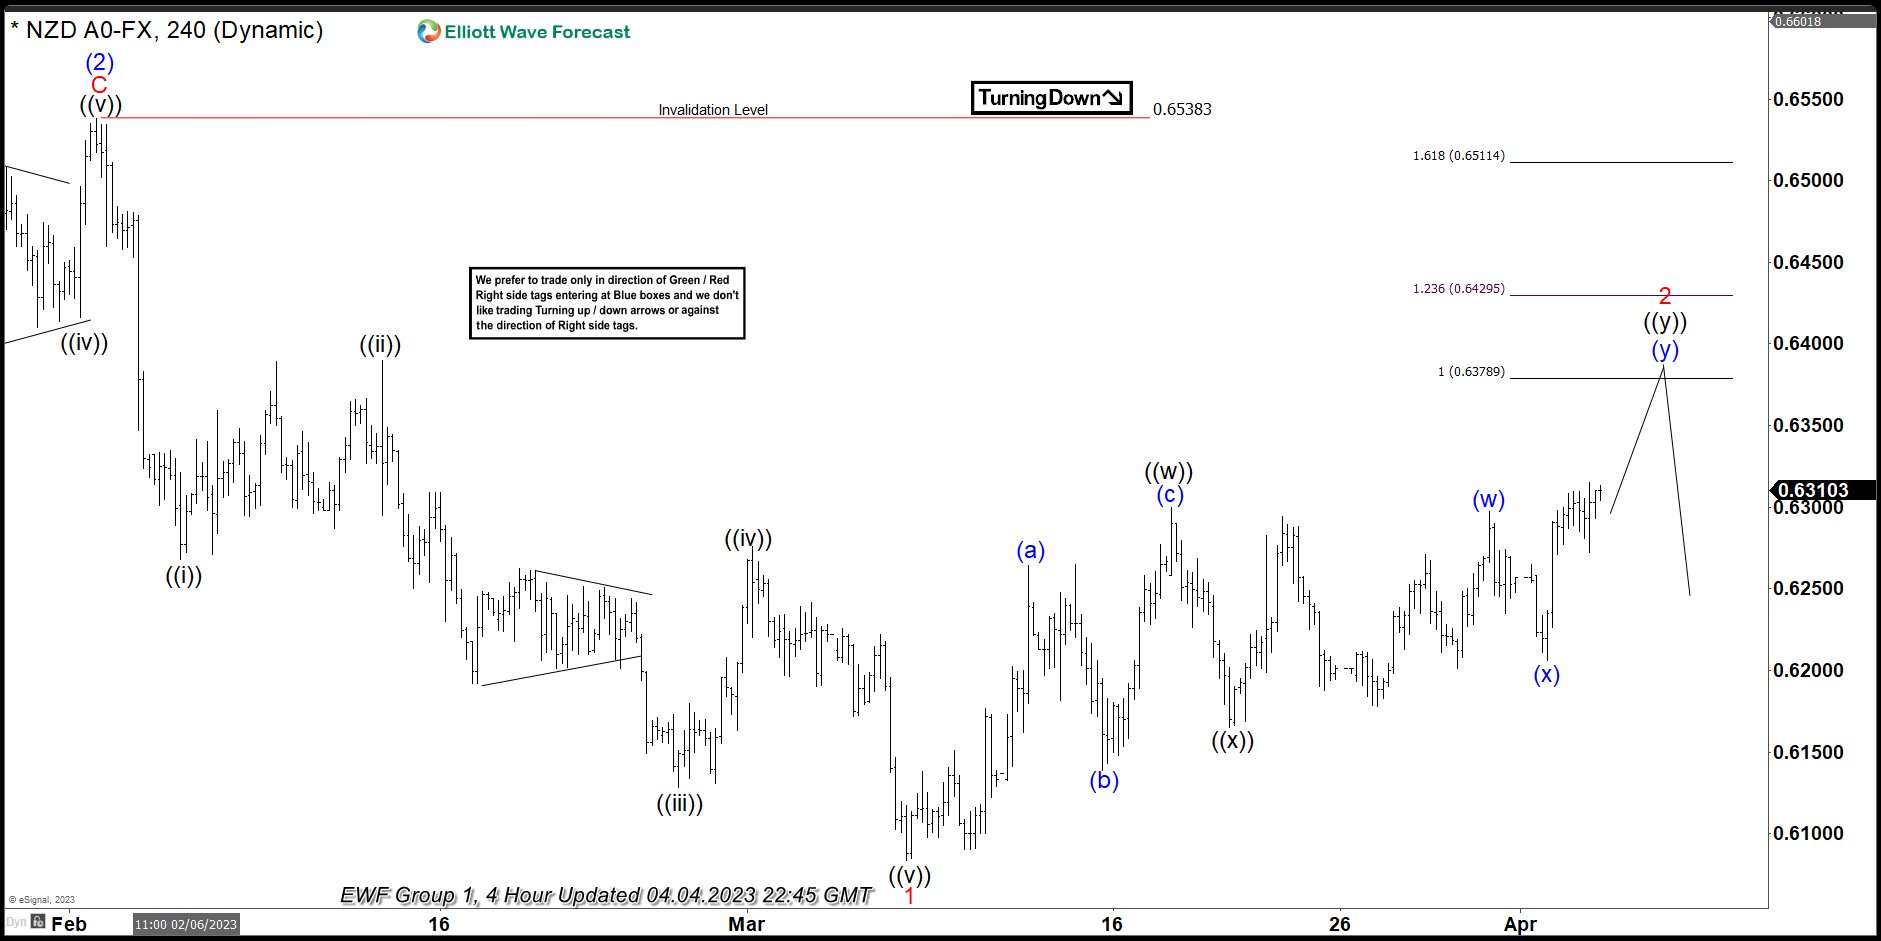
NZDUSD 1h Hour Elliott Wave Analysis 04.04.2023
NZDUSD is giving us 2 red recovery that is unfolding as Elliott Wave Double Three Pattern. Correction has ((w))((x))((y)) black inner labeling. The price structure is still incomplete. We expect to see more short term strength in 7th swing toward 0.63789-0.64295 area to complete proposed correction. At that zone buyers should be ideally taking profits and sellers can appear again. Consequently , we expect to see reaction from the marked area. The pair can give us either decline toward new lows or larger 3 waves pull back at least.
NZDUSD 1h Hour Elliott Wave Analysis 04.11.2023
The pair made extension higher and sellers appeared right at the marked extreme zone : 0.63789-0.64295 . So far NZDUSD is giving us a good reaction from the equal legs area. Current view suggests 2 red recovery completed at 0.63817 high. We could be ending short term cycle from the mentioned peak as 5 waves structure and expecting to see 3 waves bounce. The price now must hold below 0.63817 high peak in order to keep proposed view intact, otherwise larger correction can be taking place. We should wait for a break of 1 red low , which will confirm next leg down is in progress.


