
Bears couldn’t keep control of the market, and ETH/USD started to correct upwards after touching a low of $1,763 on 9 April.
ETHUSD is now moving under a strong bullish momentum after crossing the $2,000 resistance and may touch $2,100 and $2,200 levels.
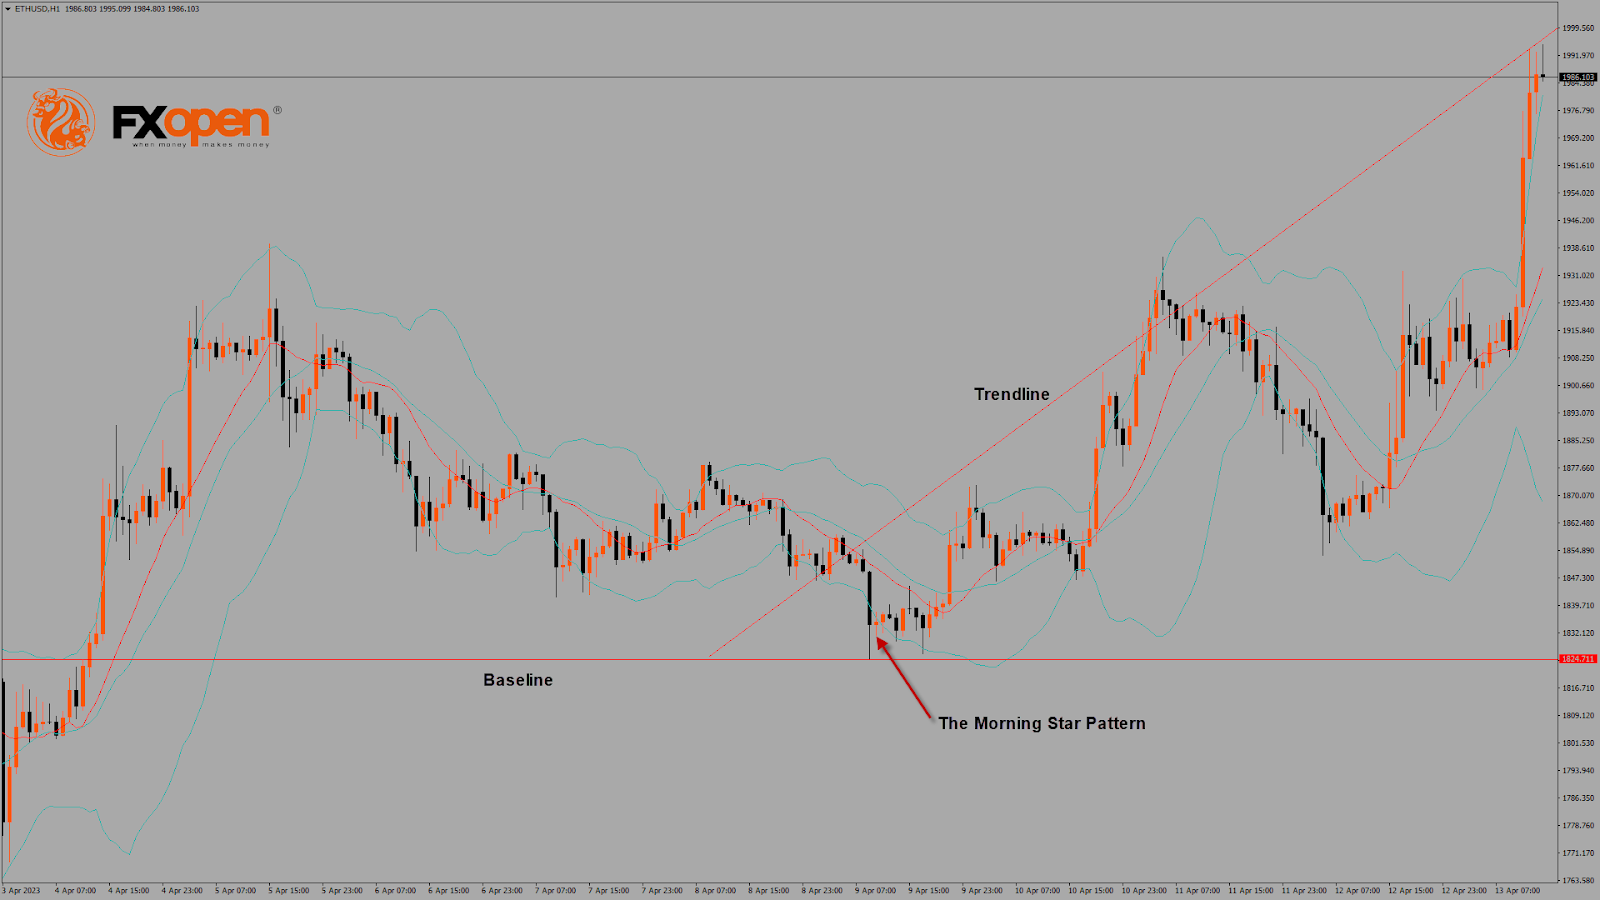
The morning star pattern is above the $1,824 handle on the H1 timeframe. It’s a bullish pattern, which signifies the end of a bearish phase.
The relative strength index is at 78.57, indicating a strong demand for Ether and a continuation of the buying pressure in the markets.
The STOCHRSI and Williams’s percent range give an overbought signal, meaning that the price is expected to decline in the short-term range.
Most of the technical indicators are bullish. Most moving averages are bullish.
ETH is now trading above the 100-hour simple and 200-hour exponential moving averages.
- Ether bullish reversal is seen above the $1,824 mark.
- The short-term range is expected to be strongly bullish.
- The average true range indicates low market volatility.
Ether Bullish Reversal Is Seen Above $1,824
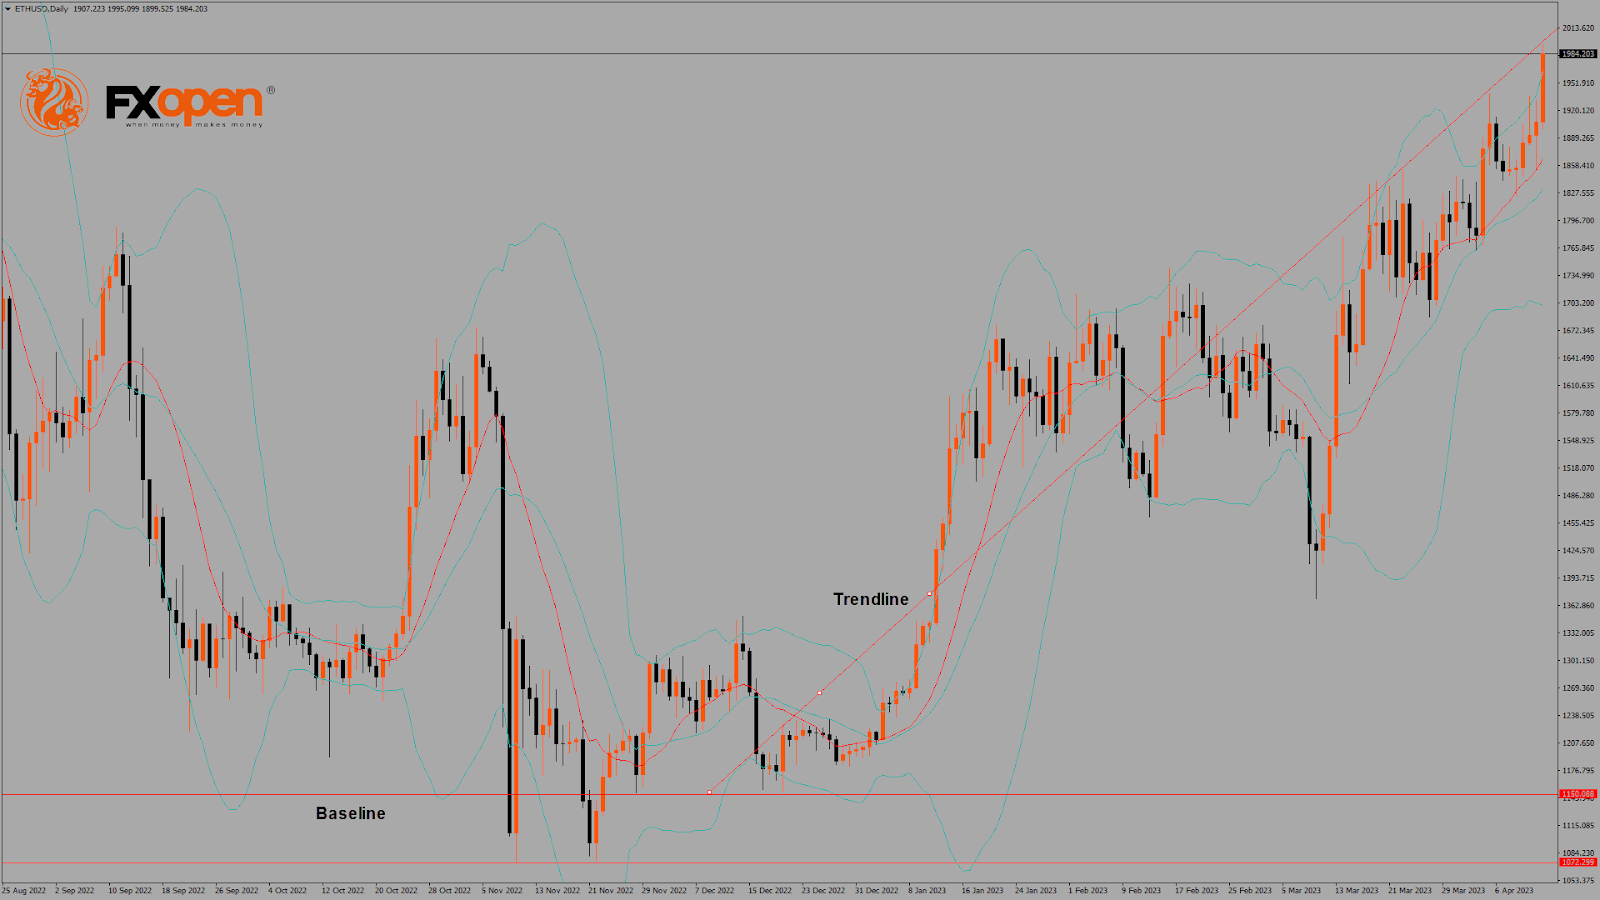
On the daily chart, ETH is trading just above its pivot level of $1,987 and is moving into a very strong bullish channel. The price has already crossed its classic resistance level of $1,991 and Fibonacci resistance level of $1,997; further upsides are located at $2,050 and $2,100.
A bullish price crossover is formed with the 20-week and 50-week adaptive moving averages in the weekly timeframe. The key support levels to watch are $1,938, which is the first resistance level of the pivot point indicator, and $1,962.
The Week Ahead
ETH has crossed the $2,000 barrier, and now we are heading towards the $2,100 level in the medium-term range in the H1 timeframe.
There is a bullish ascending channel forming from $1,824 towards the $1,999 level.
There is a major bullish trendline with the support located at $1,775, which is a 14-day RSI at 50.
The immediate short-term outlook for Ether has turned as mildly bullish, the medium-term outlook has turned bullish, and the long-term outlook for Ether is neutral in present market conditions.
The resistance zone is located at $2,024, which is a 14-day RSI at 70%, and at $2,029, which is a 50% Fib retracement from 52-week High/Low.
The weekly outlook is $2,200 with a consolidation zone of $2,100.


