
In this article we’re going to take a quick look at the Elliott Wave charts of GBPUSD , published in members area of the website. As our members know, we have been favoring the long side in the pair. We recommended members to avoid selling , while keep favoring the long side. Recently we got correction that has unfolded as Elliott Wave Double Three pattern. It has reached our buying zone and made rally toward new highs as expected. In the further text we are going to explain the Elliott Wave Forecast and trading strategy.
Before we take a look at the real market example, let’s explain Elliott Wave Double Three pattern.
Elliott Wave Double Three Pattern
Double three is the common pattern in the market , also known as 7 swing structure. It’s a reliable pattern which is giving us good trading entries with clearly defined invalidation levels.
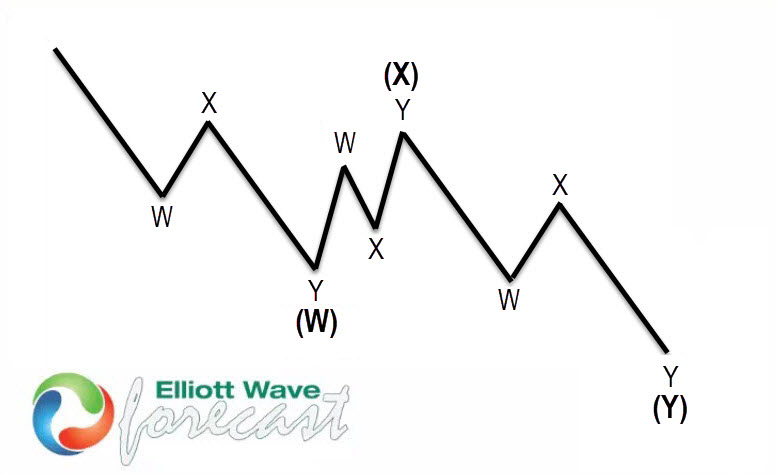
The picture below presents what Elliott Wave Double Three pattern looks like. It has (W),(X),(Y) labeling and 3,3,3 inner structure, which means all of these 3 legs are corrective sequences. Each (W) and (Y) are made of 3 swings , they’re having A,B,C structure in lower degree, or alternatively they can have W,X,Y labeling.
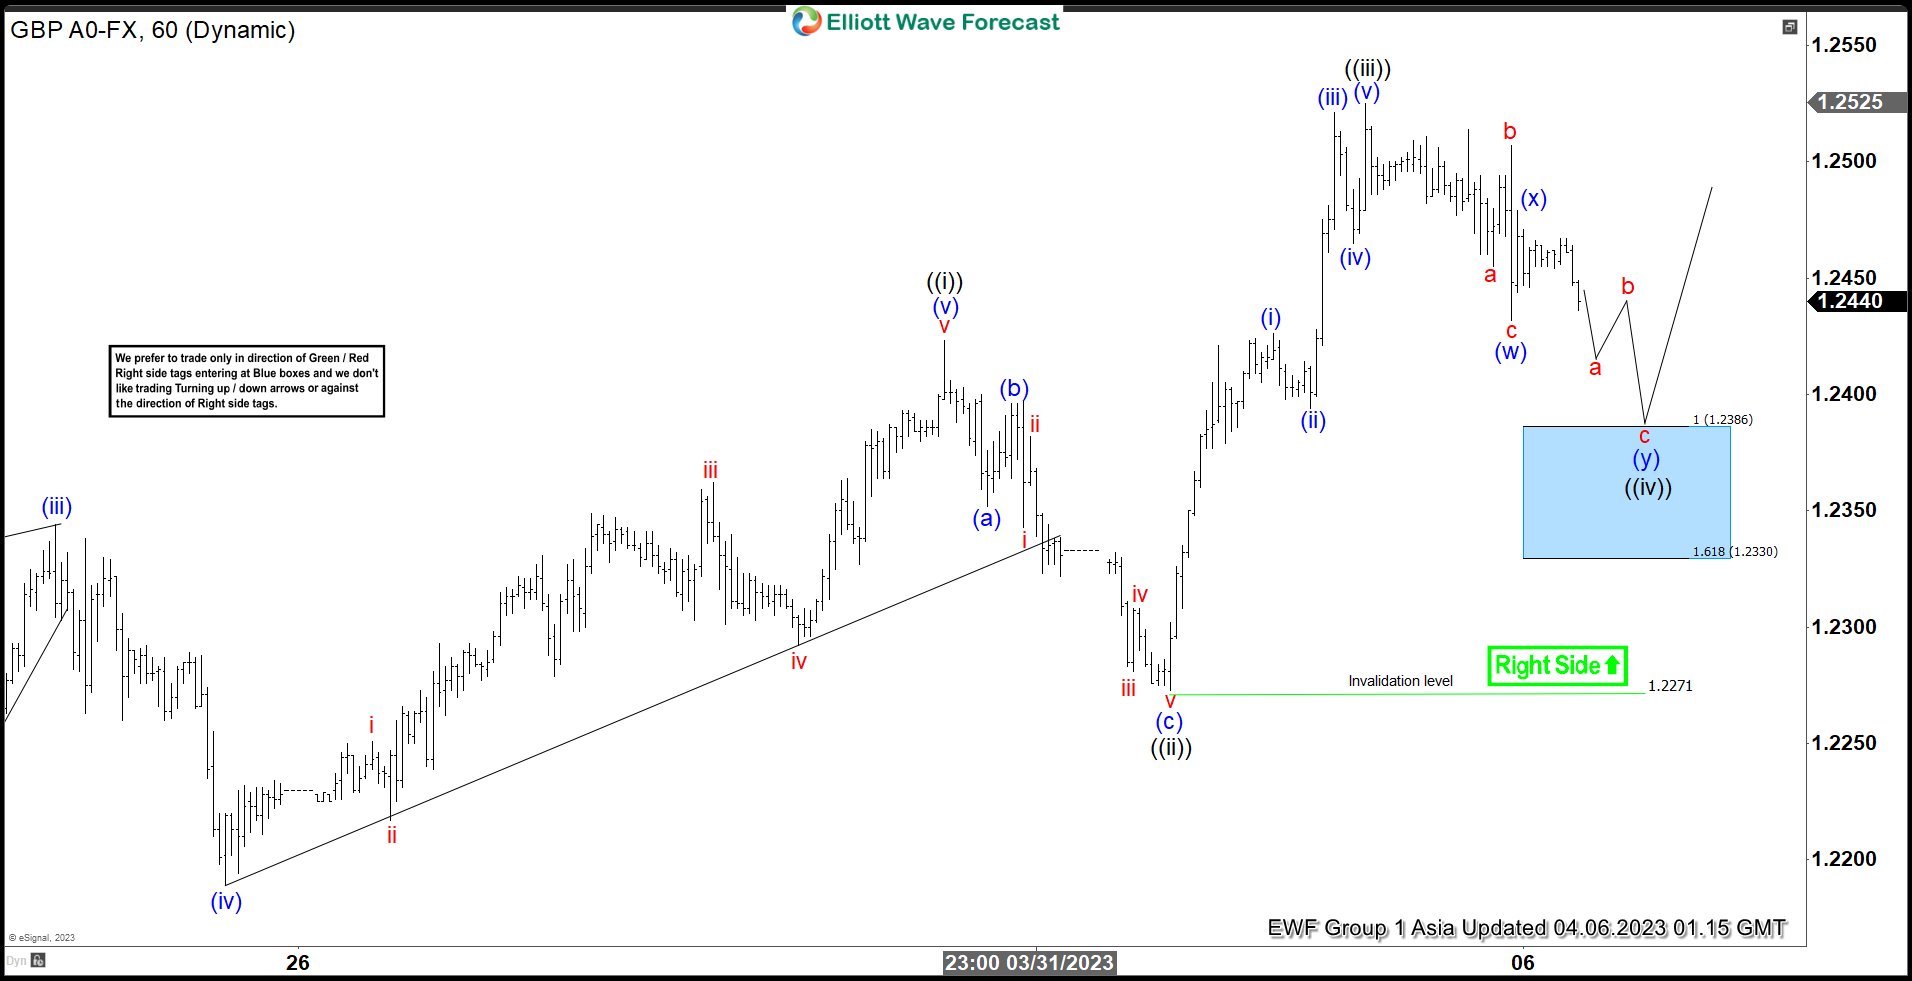
GBPUSD Elliott Wave 1 Hour Chart 04.06.2023
The pair is giving us wave ((iv)) pull back that is unfolding as Double Three pattern. At this stage we believe 5th swing is in progress,so missing 6th and 7th. We expect to get more short term weakness toward 1.2386-1.233 area which would be our next buying zone. We don’t recommend selling the pair against the main bullish trend. Strategy is waiting for the price to reach blue box- equal legs zone, before entering the long trades again. Once bounce reaches 50 Fibs against the (x) blue high , we will make long position risk free ( put SL at BE) and take partial profits. Invalidation for the long trades is break of 1.618 fib ext : 1.2330
Quick reminder:
Our charts are easy to trade and understand:
Red bearish stamp+ blue box = Selling Setup
Green bullish stamp+ blue box = Buying Setup
Charts with Black stamps are not tradable. 🚫
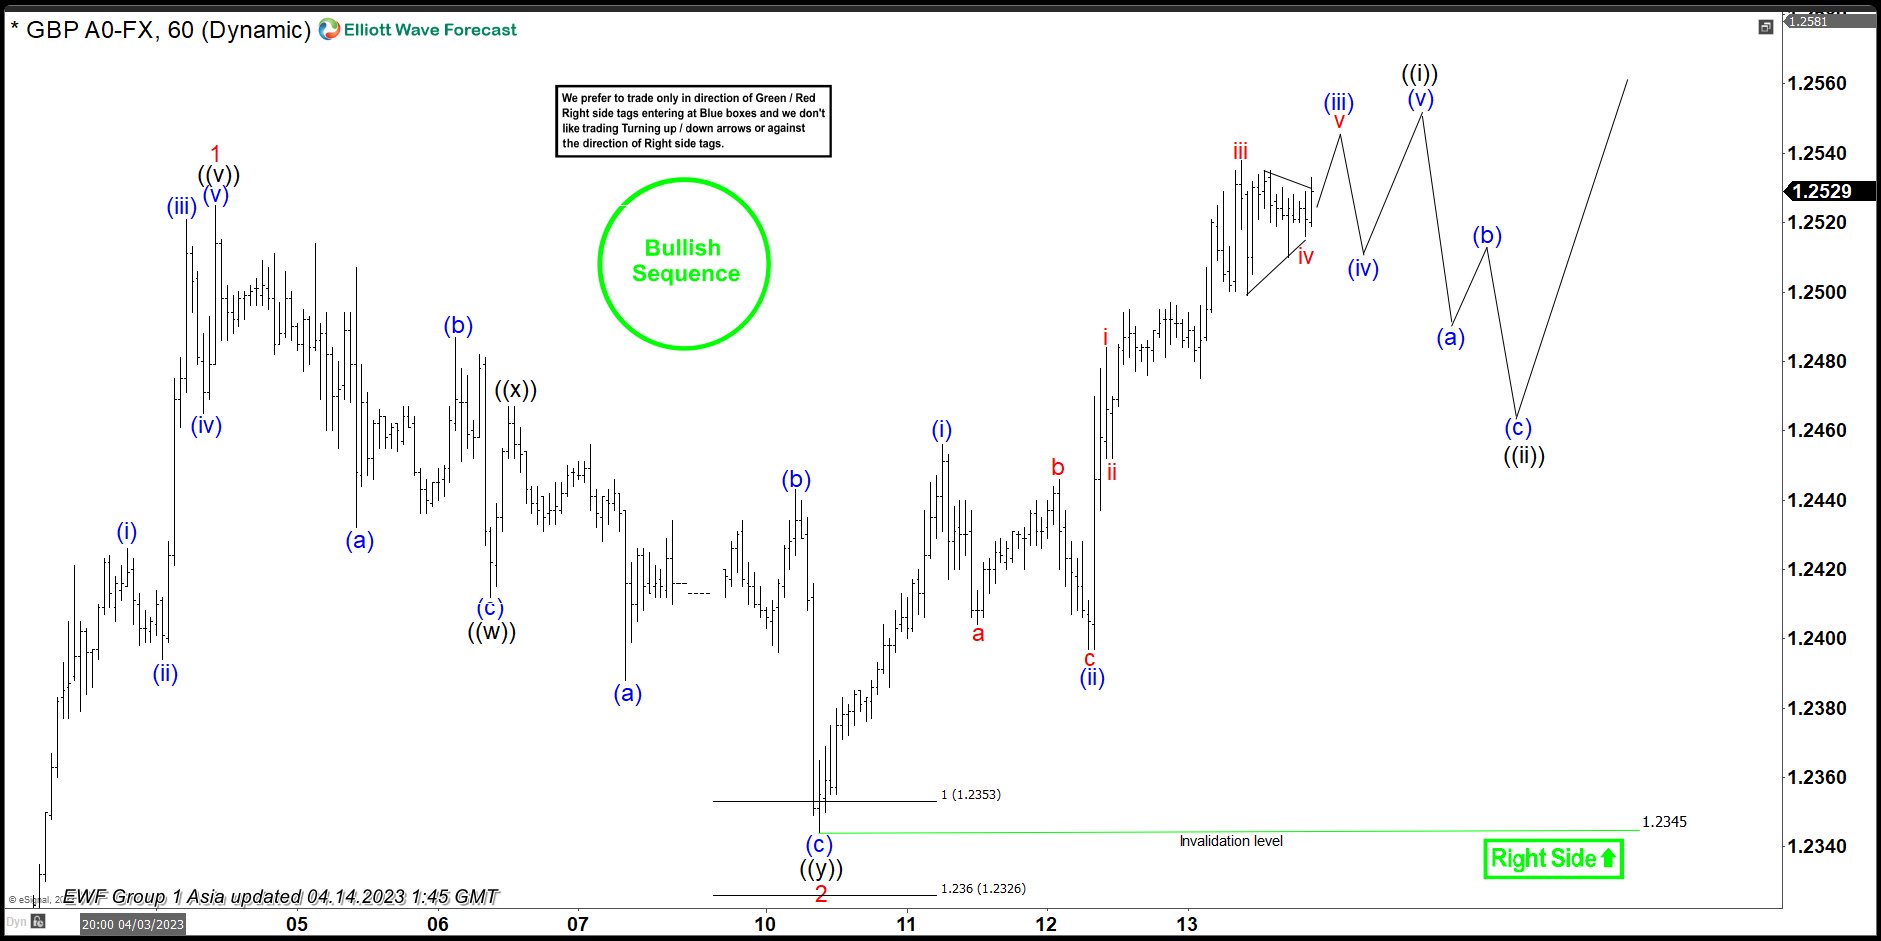
GBPUSD Elliott Wave 1 Hour Chart 04.14.2023
GBPUSD made 7 swing down and reached buying zone at 1.2386-1.233 area( blue box) . The pair is giving us very good reaction from the buying zone. The price has already made a break toward new highs. So, members who took the long trade are enjoying profits now in a risk free positions.
Keep in mind that market is dynamic and presented view could have changed in the mean time. You can check most recent charts in the membership area of the site. Best instruments to trade are those having incomplete bullish or bearish swings sequences. We put them in Sequence Report and best among them are shown in the Live Trading Room.


