
Bulls were able to take control of the market, and after touching a low of $1,805 on May 1, the ETH/USD pair moved upwards, touching a high of $1,916 today in the early Asian trading session. The bullish engulfing pattern is above the $1,805 handle on the H1 timeframe. It’s a bullish pattern, which signifies the end of a bearish phase.
The market opened bullish this week. The ETH price remains well supported above the $1,800 level and is back above the pivot point.
The relative strength index is at 61.03, indicating a strong demand for Ether and a continuation of the buying pressure in the market.
Both the STOCH and CCI are neutral, meaning that the price is expected to enter into a consolidation zone in the short-term range.
A bullish reversal pattern with the 50-period moving average in the 2-hour timeframe was formed.
Most of the technical indicators are bullish. Most moving averages are bullish at the current Ethereum price of $1,899.
ETH is now trading above the 100-hour simple and 200-hour exponential moving averages.
- ETH price is showing a bullish reversal above the $1,805 mark.
- The short-term range is expected to be mildly bullish.
- The average true range indicates low market volatility.
- The ETH price ranges near the support of the channel.
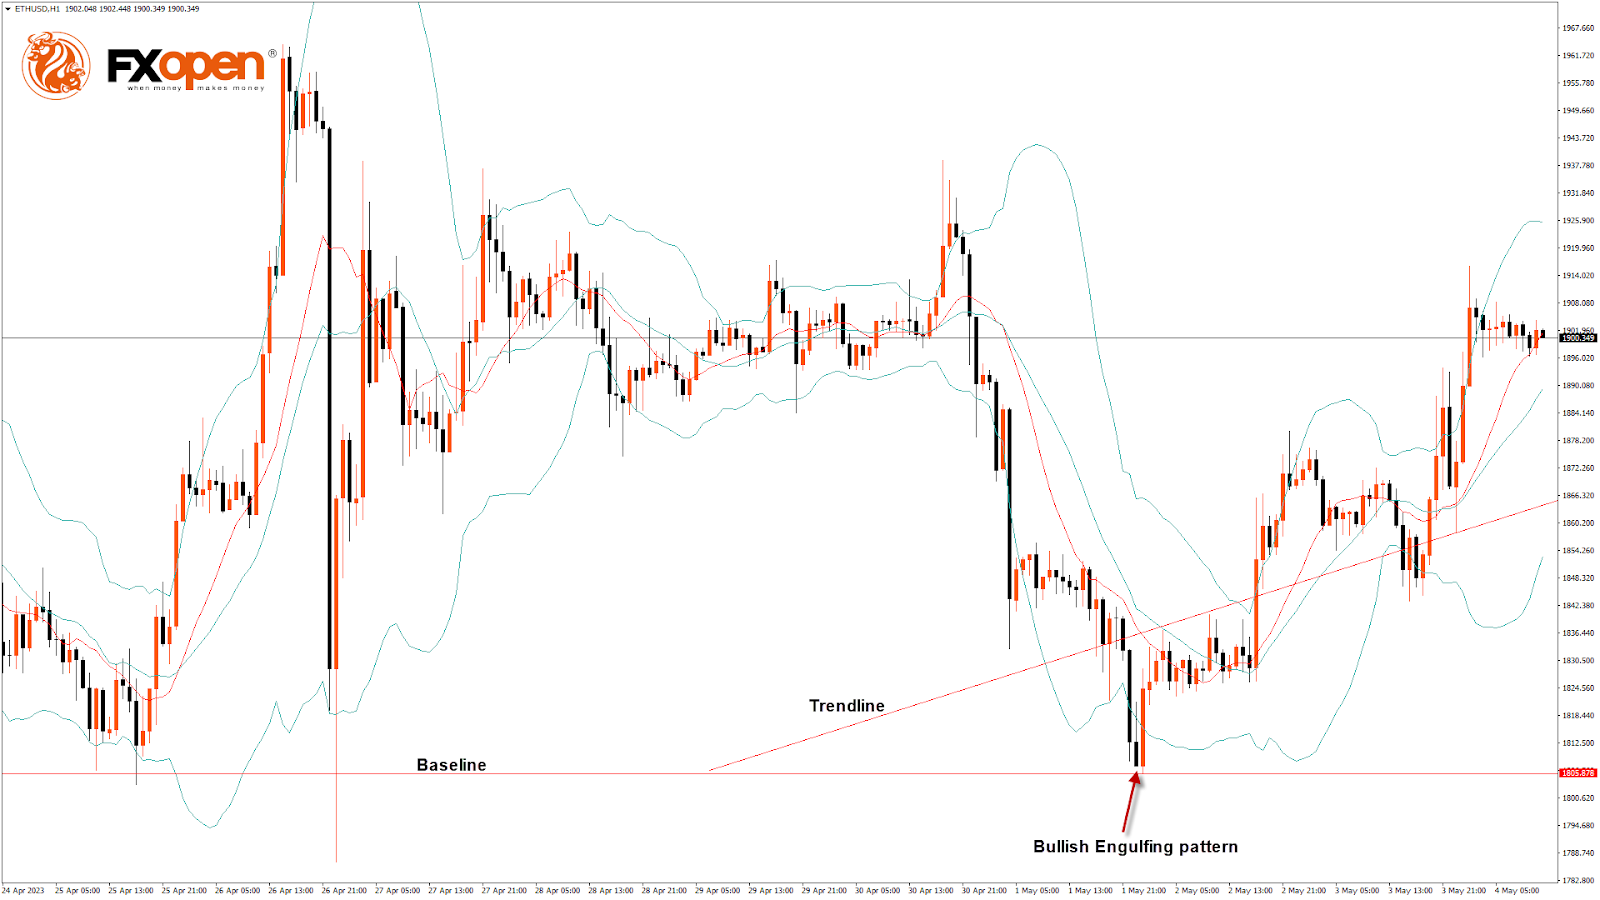
ETH Bullish Reversal Is above $1,805
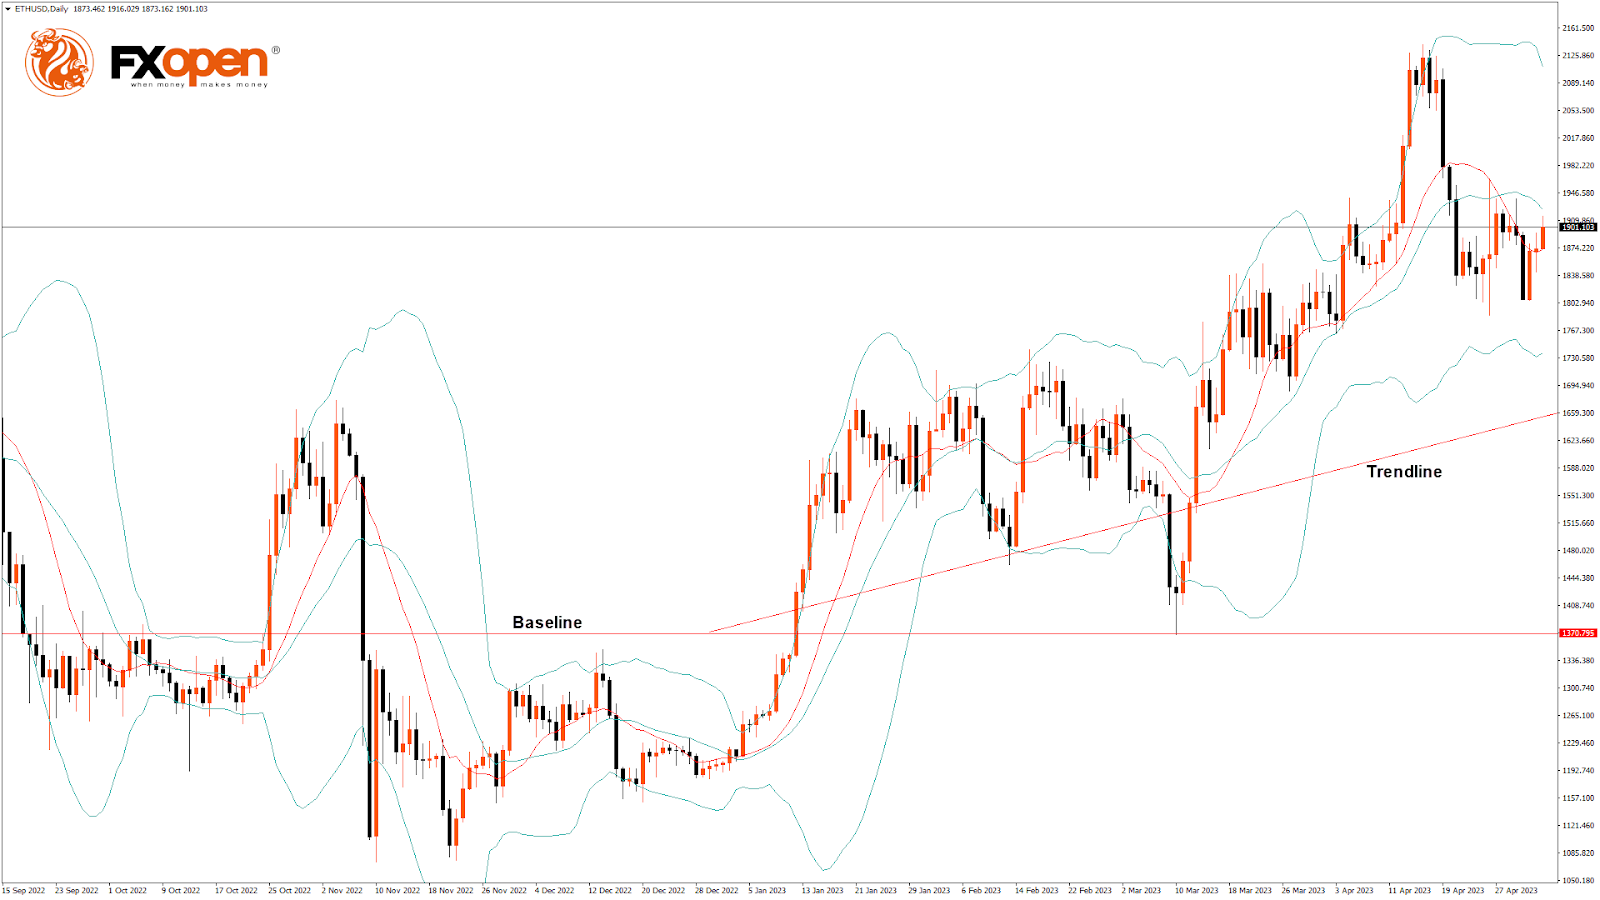
On the daily chart, ETH is trading just below its pivot level of $1,900 and is moving in a mild bullish channel. The price is about to break its classic resistance level of $1,904 and its Fibonacci resistance level of $1,907. Supports are $1,870 and $1,886.
Some of the technical indicators signal neutral market sentiment.
We can see the formation of a bullish engulfing pattern in the 2-hour timeframe.
The key support levels to watch are $1,866, which is a 14-day RSI at 50, and $1,890, which is a 3-10 day MACD oscillator.
The Week Ahead
ETH price remains well supported above $1,800, indicative of the bullish momentum, and the next visible targets are located at $1,900 and $1,950 in the medium-term range in the H1 timeframe.
We see a short-term bullish trend line from $1,805 toward $1,912.
The immediate short-term outlook for ETH has turned mildly bullish, the medium-term outlook has turned bullish, and the long-term outlook is neutral in present market conditions.
The resistance zone is at $1,925, which is a 38.2% retracement from the 4-week low, and at $1,965, which is a 14-3 day raw stochastic at 50.
The weekly outlook is $2,000, with a consolidation zone of $1,970.


