
Bulls were able to take control of the market last week, and after touching a low of $79.64 on 13 May, the price started to correct higher against the US Dollar, crossing the $94.00 handle today in the European trading session.
The short-term outlook for Litecoin has turned mildly bullish.
On the H1 timeframe:
- There is an inverted hammer pattern above the $79.64 handle. It signifies the end of a bearish phase and the start of a bullish phase in the market.
- Litecoin price is trading above its 100-hour simple moving average and 200-hour exponential moving average and just above its pivot level of $92.97.
- The relative strength index is at 69.02, indicating a strong demand for Litecoin and a shift towards the bullish phase in the markets.
- Litecoin remains above most of the moving averages, which is a bullish signal at current market levels of $93.20.
- Some of the technical indicators are bullish.
- The average true range indicates low market volatility.
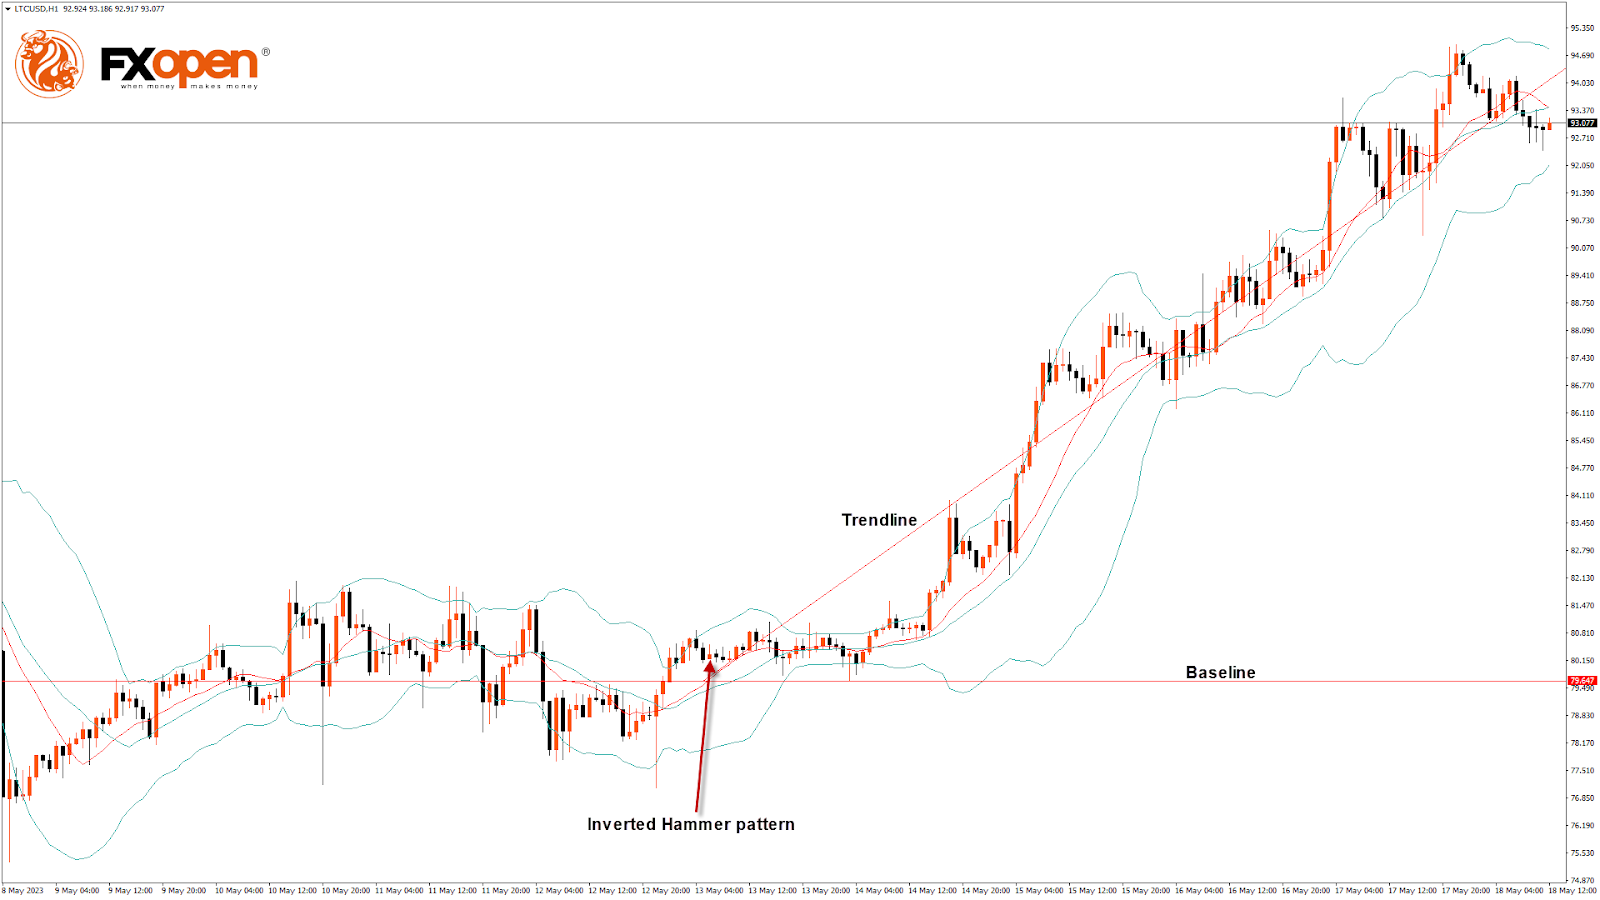
Litecoin Bullish Reversal Seen above $79.64
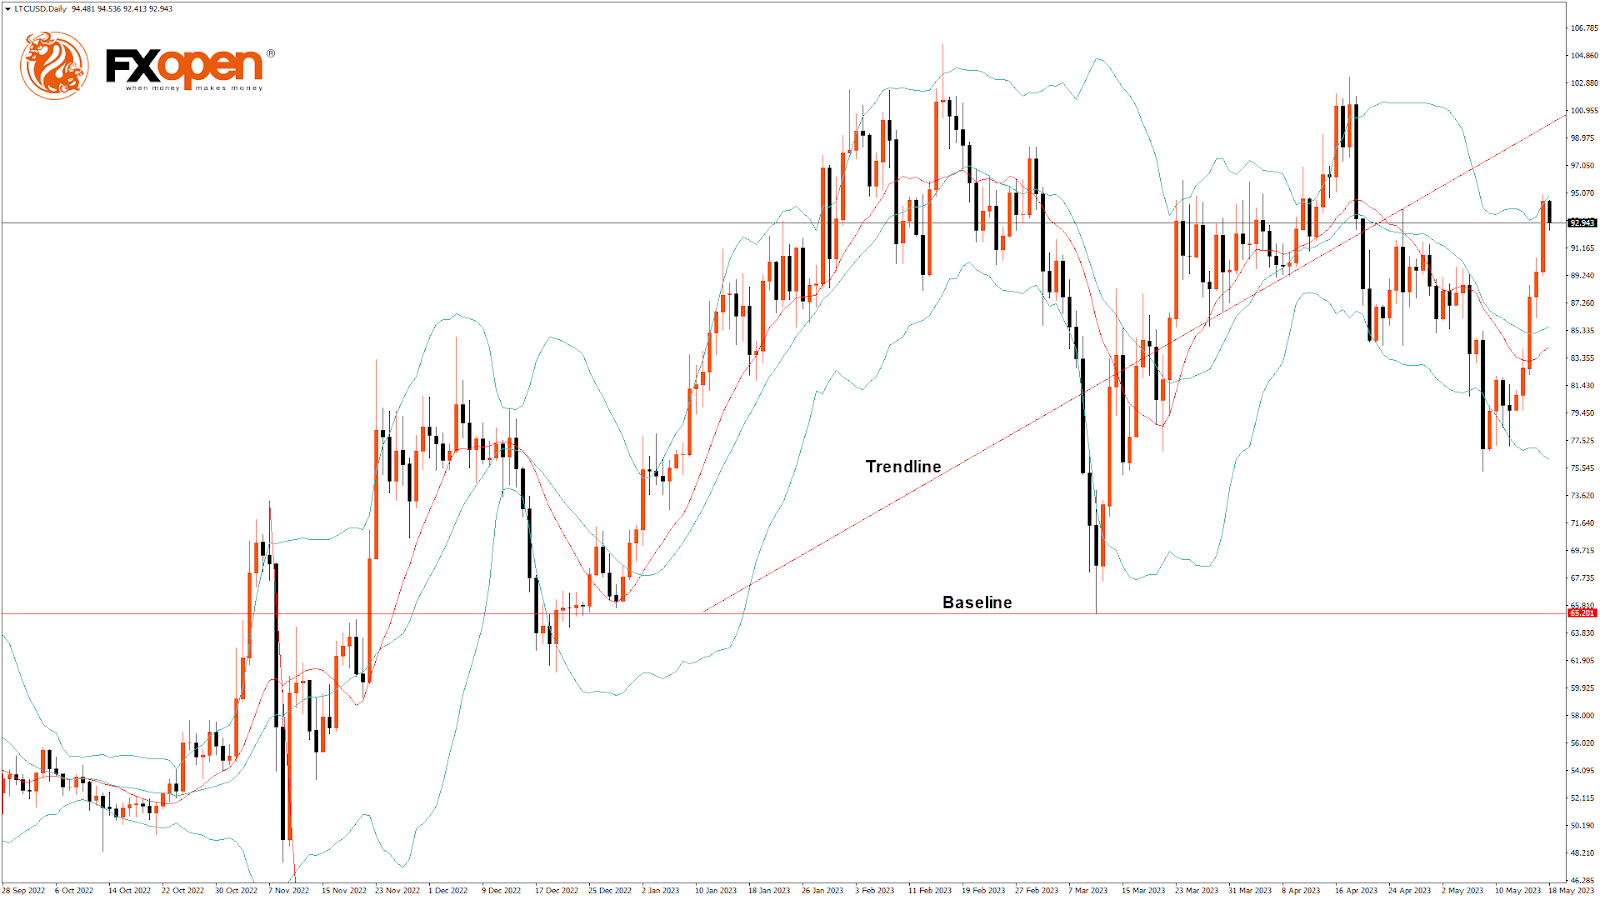
On the D1 timeframe:
- Litecoin continues to move in a bullish momentum after its recent decline below $80.00.
- Litecoin to USD exchange rate is ranging above $90.00 with more upsides at $94 and $95 levels.
- The resistance of the channel is broken.
On the weekly timeframe:
- The market opened bullish.
- We can see the formation of the morning star pattern, which indicates a bullish trend.
- We can see the formation of a bullish price crossover pattern with 20- and 50-period adaptive moving averages.
LTCUSD is about to break its classic resistance level of 93.55 and Fibonacci resistance level of 94.18, after which the path towards $95 will get cleared.
Litecoin faces resistance at $96.53, which is a pivot point’s first resistance level, and at $98.58, which is a pivot point’s second resistance level.
The Week Ahead
Litecoin price continues to correct higher against the US Dollar, and a strong bullish momentum is visible, with further upsides located at $95 and $100.
Most technical indicators signal a bullish sentiment in the market.
Litecoin price should stay above the important support level of $87.40, which is a 14-day RSI at 50, and at $88.65, at which the price crosses the 9-day moving average.
The weekly projection for Litecoin price is $98, with a consolidation zone near $95.
The short-term outlook for Litecoin has turned strongly bullish, the medium-term outlook is bullish, and the long-term outlook is neutral at present market conditions.


