
A note on lower timeframe confirming price action…
Waiting for lower timeframe confirmation is our main tool to confirm strength within higher timeframe zones, and has really been the key to our trading success. It takes a little time to understand the subtle nuances, however, as each trade is never the same, but once you master the rhythm so to speak, you will be saved from countless unnecessary losing trades. The following is a list of what we look for:
- A break/retest of supply or demand dependent on which way you’re trading.
- A trendline break/retest.
- Buying/selling tails – essentially we look for a cluster of very obvious spikes off of lower timeframe support and resistance levels within the higher timeframe zone.
- Candlestick patterns. We tend to only stick with pin bars and engulfing bars as these have proven to be the most effective.
EUR/USD
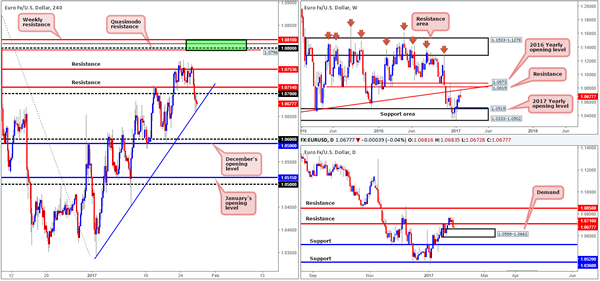
Looking at the weekly chart this morning, it’s reasonably easy to see who’s in control of the market at the moment. Price has reacted to a long-term weekly trendline resistance stretched from the low 0.8231, and is on course to form a weekly selling tail, potentially breaking a five-week bullish phase. Meanwhile, down on the daily timeframe, daily support at 1.0710 was engulfed yesterday (now an acting resistance), consequently forcing price to connect with the top edge of a daily demand area registered at 1.0589-1.0662.
With the US dollar surging higher across the board, the H4 candles broke through psychological support at 1.07 yesterday, and ended the day shaking hands with a H4 trendline support extended from the low 1.0340. A reaction from this angle has already been seen, but so far price has been unable to sustain gains beyond 1.07, which is now acting resistance!
Our suggestions: With the weekly timeframe suggesting lower prices may be on the cards, and the daily timeframe recently touching gloves with a daily demand area, higher-timeframe direction is a little restricted for the time being. On the H4 chart, as you can see, the upside is limited by the nearby 1.07 handle, followed closely by H4 resistance at 1.0714. A break below the current H4 trendline support, however, could lead to a move down to December’s opening barrier at 1.0590, which is shadowed closely by the 1.06 handle. Be that as it may, shorting the break of this line places one in direct conflict with potential daily buyers, and that is not somewhere we’d feel comfortable trading.
In light of the above points, our desk has come to a general consensus that remaining on the sidelines may be the better path to take today.
Data points to consider: 4th quarter Advance GDP print from the US, along with US durable goods orders at 1.30pm GMT.
Levels to watch/live orders:
- Buys: Flat (stop loss: N/A).
- Sells: 1.08 region ([dependent on the time of day, this is an area we would consider trading without confirmation] stop loss: 1.0825 [aggressive stop] 1.0875 [conservative stop]).
GBP/USD:
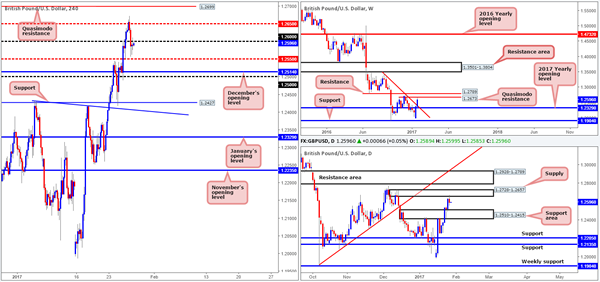
UK preliminary figures came in slightly above expectations yesterday, which, as can be seen on the M30 chart, was largely ignored by the market. After whipsawing through the H4 mid-way resistance coming in at 1.2650 (in the shape of a H4 two-candle bearish formation), price followed through with a H4 bearish close below 1.26, missing the H4 mid-way support at 1.2550 by a whisker!
As we write, 1.26 is holding firm as resistance. Through the simple lens of a technical trader, we believe the pendulum looks to be swinging in the direction of a continuation move south today. Over on the weekly candles, we can see that price recently collided with a weekly Quasimodo resistance drawn from 1.2673. On top of this, the daily chart rebounded from a daily supply at 1.2728-1.2657 during the course of yesterday’s session.
Our suggestions: Based on our analysis above, 1.26 could potentially hold as a resistance today and force price down as far as December’s opening base at 1.2514. Why 1.2514? The next downside target on the higher-timeframe picture can be seen at 1.2510-1.2415: a daily support area, which sits just below the above noted monthly opening line. With this in mind, our prime focus today will be on looking for lower-timeframe shorting opportunities around the 1.26 hurdle. This could be either a break of demand followed by a retest as supply, a trendline break/retest or simply a collection of well-defined selling wicks seen positioned around the H4 level. We typically search for lower-timeframe confirmation between the M15 and H1 timeframes, since most of our higher-timeframe areas begin with the H4. Stops are usually placed 3-5 pips beyond confirming structures.
Data points to consider: 4th quarter Advance GDP print from the US, along with US durable goods orders at 1.30pm GMT.
Levels to watch/live orders:
- Buys: Flat (stop loss: N/A).
- Sells: 1.26 region ([wait for a lower-timeframe confirming setup to form before looking to execute a trade] stop loss: dependent on where one confirms this area).
AUD/USD
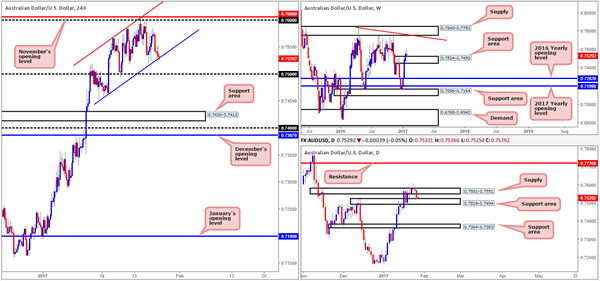
During the course of yesterday’s sessions, the commodity-linked currency spent the day fading from highs of 0.7585. Although this movement forced the H4 candles to retest the H4 channel support line extended from the low 0.7449, this supportive barrier looks incredibly vulnerable at present, as upside is currently capped by the H4 mid-way resistance 0.7550. Despite this, daily price is seen trading just ahead of a daily support area fixed at 0.7524-0.7494, which also marks the top edge of a weekly support zone coming in at 0.7524-0.7450.
Our suggestions: With this in mind, the buyers may very well still have a hand in this fight! While we agree the H4 candles seem to be reflecting more a bearish stance at the moment, we cannot ignore what the bigger picture is suggesting. As a result, we’re going to be keeping a close eye on the aforementioned H4 channel support today for lower-timeframe buying opportunities (see the top of this report).
Data points to consider: 4th quarter Advance GDP print from the US, along with US durable goods orders at 1.30pm GMT.
Levels to watch/live orders:
- Buys: Keep a tab on the above noted H4 channel support for buying opportunities ([wait for a lower-timeframe confirming setup to form before looking to execute a trade] stop loss: dependent on where one confirms this area).
- Sells: Flat (stop loss: N/A).
USD/JPY
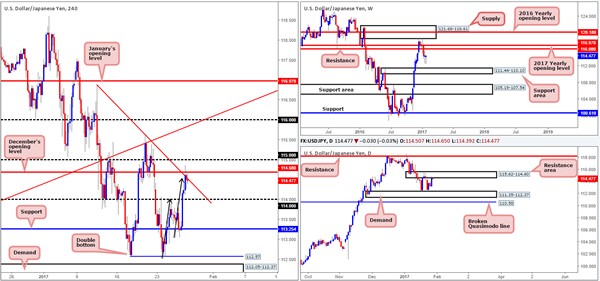
A strong session for the USD/JPY yesterday brought price to highs of 114.85 on the day. Despite this, yesterday’s Bull Run could be tested today! Traders may want to note that daily action is currently seen teasing the lower edge of a daily resistance area at 115.62-114.60, and H4 price recently connected with December’s opening line at 114.68. This – coupled with H4 price converging with a H4 trendline resistance taken from the high 116.87, a H4 AB=CD symmetrical approach which tops out around the 114.55 neighborhood (see black arrows) and of course, space seen for price to move lower down to at least the psychological support handle 114.
Our suggestions: While we believe that the pair is likely headed southbound today, we seemed to have missed the boat for a touch trade (pending order). Therefore, we’ll continue to watch how the lower-timeframe action behaves during today’s sessions, and may, assuming we’re able to identify a lower-timeframe sell setup (see the top of this report for ideas on what we consider a favorable setup), look to go short, targeting 114.
Data points to consider: 4th quarter Advance GDP print from the US, along with US durable goods orders at 1.30pm GMT.
Levels to watch/live orders:
- Buys: Flat (stop loss: N/A).
- Sells: 114.68 region ([wait for a lower-timeframe confirming setup to form before looking to execute a trade] stop loss: dependent on where one confirms this area).
USD/CAD
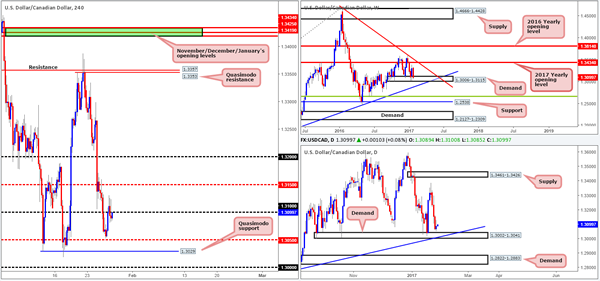
Kicking this morning’s report off with a look at the weekly chart shows us that the buyers and sellers remain battling for position within weekly demand drawn from 1.3006-1.3115. A breakdown through this area, however, could lead to price challenging the weekly trendline support taken from the high 1.1278. In conjunction with the weekly timeframe, the daily candles also remain trading within reaching distance of a daily demand area penciled in at 1.3002-1.3041, which happens to merge beautifully with a daily trendline support taken from the low 1.2654.
Stepping across to the H4 chart, we can see that although the unit tapped highs of 1.3130 amid yesterday’s sessions, price concluded the day below the 1.31 handle. Should 1.31 hold ground as resistance today, the H4 mid-way support at 1.3050 will likely be the next area on the hit list, followed closely by a H4 Quasimodo support at 1.3029 and then the key figure 1.30.
Our suggestions: Seen within the two aforementioned higher-timeframe demands marked above in bold is a H4 Quasimodo support at 1.3029. Although this level boasts attractive higher-timeframe confluence, we must also take into account that this level is positioned nearby the 1.30 mark – a hurdle that is likely being watched by the majority of the market. Does this mean we should ignore longs from the H4 Quasimodo formation? No! What it does mean though is that in order to buy from this H4 base, one might (to be on the safe side) want to consider setting stops beyond the 1.30 level.
Since we can find no logical areas for stop-loss placement beyond 1.30, we’ll wait for H4 candle confirmation before deciding whether or not to buy from here.
Data points to consider: 4th quarter Advance GDP print from the US, along with US durable goods orders at 1.30pm GMT.
Levels to watch/live orders:
- Buys: 1.3029 region ([a reasonably sized H4 bull candle will need to be seen from here before a trade can be executed] stop loss: ideally beyond the trigger candle).
- Sells: Flat (stop loss: N/A).
USD/CHF
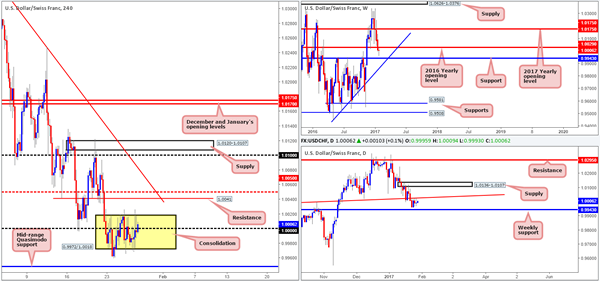
Since the beginning of the week, the H4 candles have been chiseling out a H4 consolidation zone fixed at 0.9972/1.0018, which, as you can see, also houses parity (1.0000). Beyond the top edge of this range sits a H4 resistance at 1.0041, shadowed closely by the H4 mid-way resistance at 1.0050. A breakout south of this consolidation, however, will place the H4 mid-range Quasimodo support at 0.9948 in the firing range.
Over on the weekly chart, price is seen hovering just ahead of the 2016 yearly opening level at 1.0029. Providing that this line is stable, the next area of interest can be seen at 0.9943: a weekly support level positioned just a few pips beneath the above said H4 mid-range Quasimodo support. Turning our attention to the daily candles, the daily trendline resistance taken from the high 0.9956 continues to cap upside, which could eventually lead to a decline down to the aforementioned weekly support level.
Our suggestions: Should the market decide to pierce through the lower edge of the current H4 consolidation today, one could look to enter long at the mid-range H4 Quasimodo support level at market (given its relationship with weekly price) since stops can comfortably be placed beyond the apex low (0.9929) at 0.9927.
In addition to this, shorts could also be considered from the H4 resistance 1.0041, as it’s located nearby both the 2016 yearly opening level and daily trendline resistance. Be that as it may, there’s a good chance that price could whipsaw through this H4 level and quite possibly the H4 1.0050 level as well. With that, we would not advise entering at market from here. Instead, wait for a lower-timeframe confirming sell setup to form. This could be either a break of demand followed by a retest as supply, a trendline break/retest or simply a collection of well-defined selling wicks seen positioned around the H4 level. We typically search for lower-timeframe confirmation between the M15 and H1 timeframes, since most of our higher-timeframe areas begin with the H4. Stops are usually placed 3-5 pips beyond confirming structures.
Data points to consider: 4th quarter Advance GDP print from the US, along with US durable goods orders at 1.30pm GMT.
Levels to watch/live orders:
- Buys: 0.9949 ([possible level to look at buying from without the need for additional confirmation] stop loss: 0.9927).
- Sells: 1.0041 region ([wait for a lower-timeframe confirming setup to form before looking to execute a trade] stop loss: dependent on where one confirms this area).
DOW 30
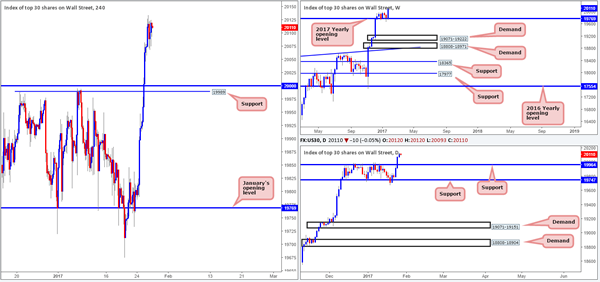
US equities rose 46 points (open/close) to record highs of 20134 yesterday, following Wednesday’s advance beyond the 20000 level. This, as you can see, marks the unit’s third consecutive daily gain this week, and with absolutely no resistance levels in sight, the market could potentially continue rallying north from here.
As a result of this movement, we feel the DOW has entered into a ‘buy-the-dip’ phase. In other words look to buy on market pullbacks. The closest support at the moment is the 20000 neighborhood, which is reinforced by H4 support at 19989 and a daily support drawn in at 19964.
Our suggestions: As things stand, unless the DOW pulls back to retest 20000 today, we may have to place this piece on the back burner for now.
Data points to consider: 4th quarter Advance GDP print from the US, along with US durable goods orders at 1.30pm GMT.
Levels to watch/live orders:
- Buys: Flat (stop loss: N/A).
- Sells: Flat (stop loss: N/A).
GOLD
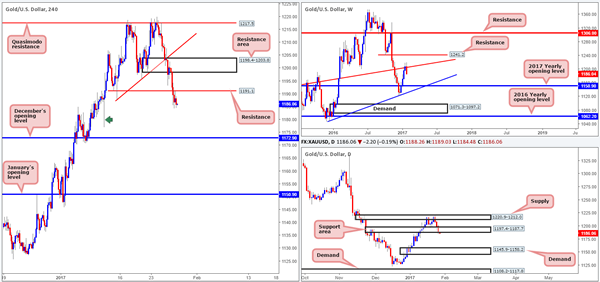
Beginning with the weekly timeframe this morning, we can see that the current weekly candle looks on course to end the week in negative territory, potentially breaking a four-week bullish phase and forming a bearish engulfing candle. The next downside target to have an eyeball on comes in at 1150.9: the 2017 yearly opening level. The story on the daily chart, however, shows that price action recently pierced below a daily support area coming in at 1197.4-1187.7, which could lead to further selling down to daily demand drawn in at 1145.9-1158.2.
Jumping across to the H4 candles, the H4 Quasimodo support level at 1191.1 was taken out going into yesterday’s London lunchtime, which, as you can see, has since been retested as resistance. The long H4 tail seen marked with a green arrow at 1177.8 is interesting, since this likely indicates demand consumption, thus opening the road south to December’s opening level at 1172.9 today.
Our suggestions: In view of this analysis, we maintain a fairly pessimistic outlook for the yellow metal today. To take advantage of this potential move, we’d look to enter short around the 1186.5 neighborhood and place stops at 1191.8, just above the current H4 resistance.
Levels to watch/live orders:
- Buys: Flat (stop loss: N/A).
- Sells: 1186.5 region ([market entry] stop loss: 1191.8).


