
Bitcoin price continues its bullish momentum from last week after touching a low of $26,121 on May 25, with strong upsides located in the range of $28,500 and $29,000.
On the hourly chart:
- We can clearly see a tweezer bottom pattern above the $26,121 handle, which indicates a bullish trend.
- Both the STOCH and STOCHRSI indicate overbought market conditions, which means that in the immediate short term, a decline in the price may occur.
- The MACD crosses UP its moving average.
- The relative strength index is at 56.95, indicating a strong demand for Bitcoin and the continuation of the buying pressure in the market.
- Most of the major technical indicators give a bullish signal, which means that in the immediate short term, the expected targets are $28,000 and $28,500.
- Bitcoin price is now moving above its 100-hour simple moving average and 100-hour exponential moving average.
- The average true range indicates low market volatility with mild bullish momentum.
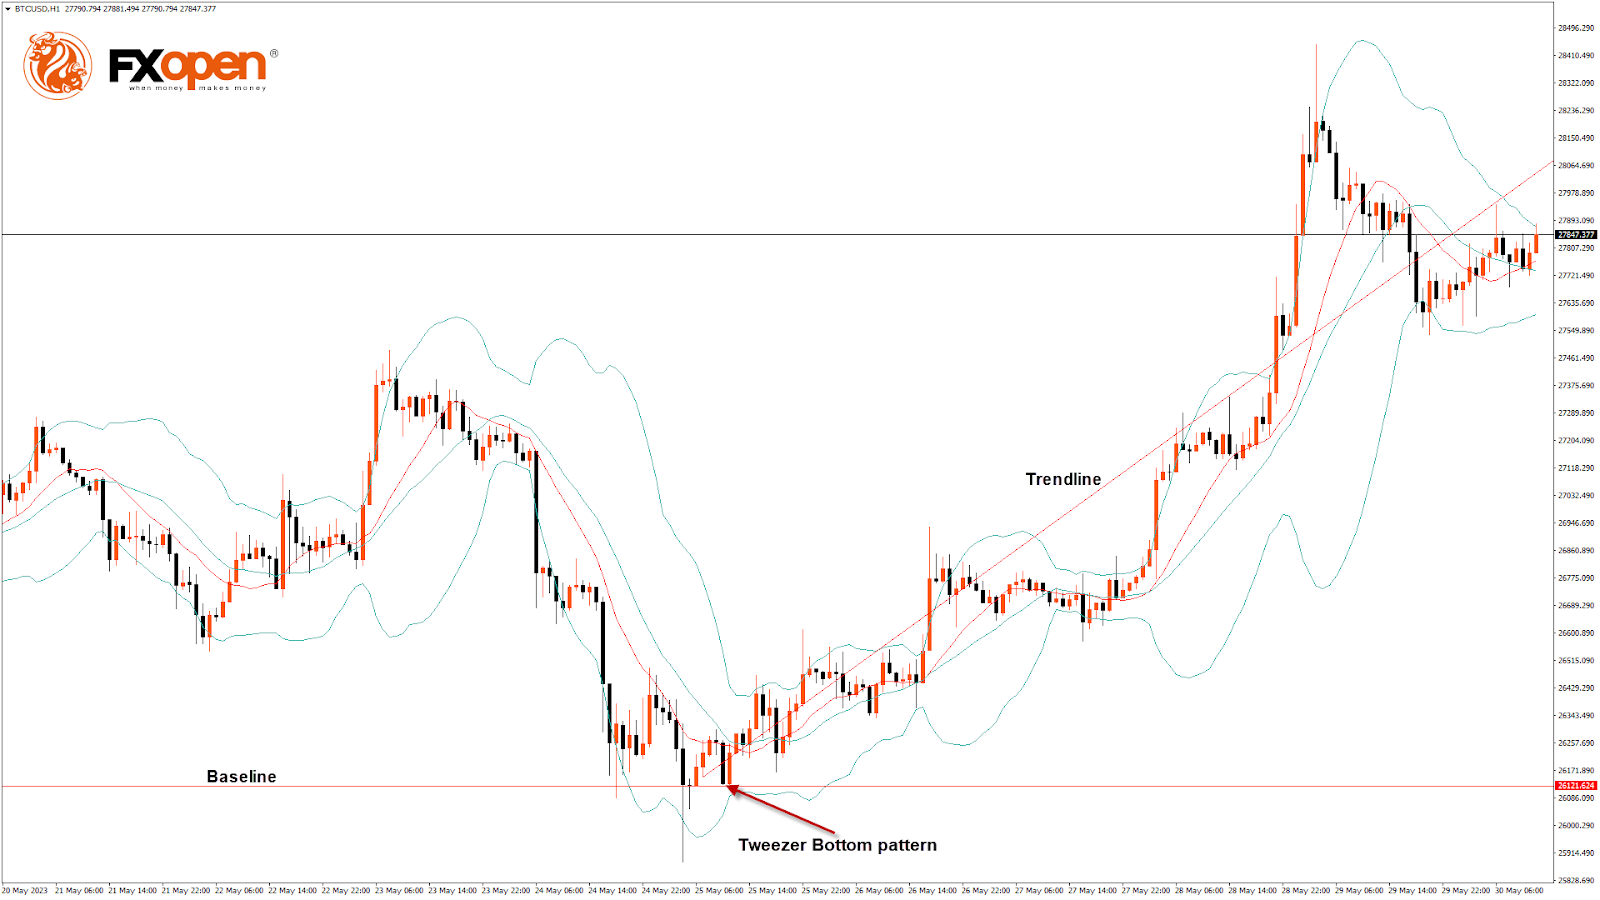
Bitcoin Bullish Continuation Seen above $26,121
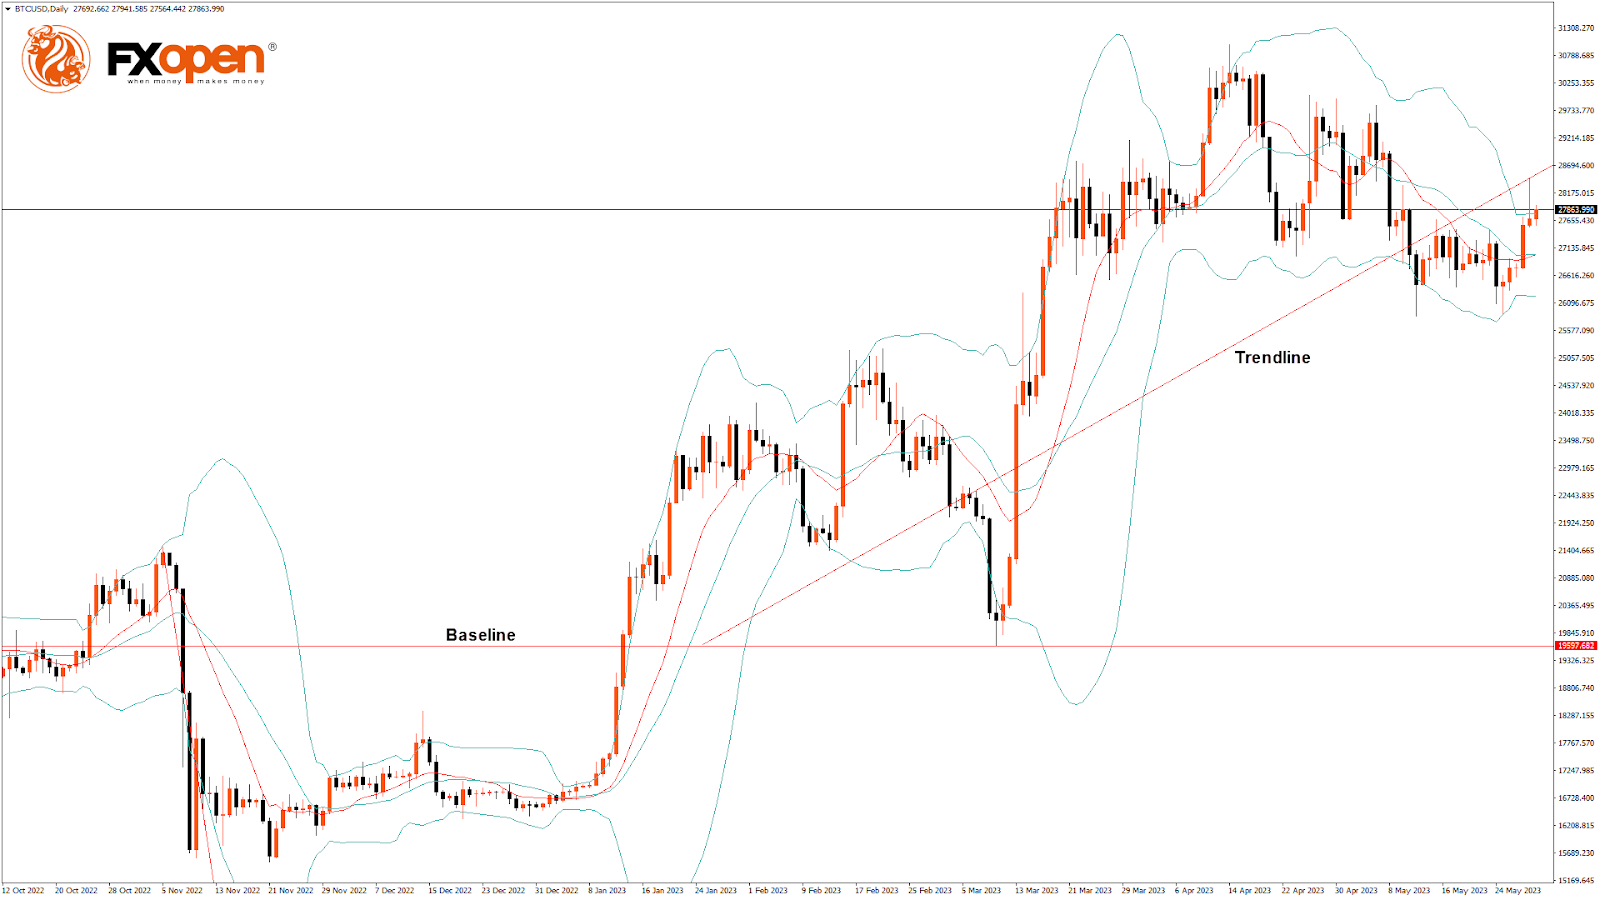
The Bitcoin to USD exchange rate entered into a consolidation zone above the $27,500 handle, after which we can see the start of the bullish move.
On the daily chart:
- A bullish harami pattern is visible.
- The RSI remains above 50, indicating a bullish market.
- The Bitcoin price is now trading above its pivot level of $27,802.
- The short-term range is mildly bullish.
- The horizontal resistance is broken.
- Bullish price crossover is seen with the AMA50 and the AMA100.
A support zone is located at $26,391, which is a 14-3-day raw stochastic at 20, and at $26,624, which is a 38.2% retracement from a 13-week high.
BTCUSD is now facing its classic resistance level of $27,854 and Fibonacci resistance level of $27,894, breaking which the price will be able to move to $28,500.
The Week Ahead
The start of this week has been excellent for Bitcoin as its price remained above the $26,000 handle, touching a high of $28,374 on 29th May.
Bitcoin price is bullish above the $28,000 handle on the daily chart with the formation of an ascending channel, with the current support at $26,729, which is a pivot point’s first support level.
The immediate expected target is $28,500, after which we may see some consolidation in the $29,000 zone.
At the moment, the price is correcting lower and trading near $27,915, which is a 50% retracement from the 4-week high/low.
We can see the formation of a bullish trend line from $26,121 to $28,056.
The BTCUSD is now facing resistance at $28,098, which is a 3-10 day MACD oscillator, and at $28,538, which is the first resistance point of the pivot point indicator.
The weekly outlook for Bitcoin price is $29,500, with a consolidation zone of $29,000.
The short-term outlook for Bitcoin is mildly bullish, the medium-term outlook has turned bullish, and the long-term outlook remains neutral under present market conditions.


