
Key Highlights
- USD/JPY started a downside correction from the 141.00 resistance.
- A key bearish trend line is forming with resistance near 140.00 on the 4-hour chart.
- EUR/USD is attempting a recovery wave above the 1.0780 level.
- GBP/USD climbed higher above the 1.2500 resistance zone.
USD/JPY Technical Analysis
The US Dollar started a downside correction from the 140.90 zone against the Japanese Yen. USD/JPY traded below the 140.00 level to move into a short-term bearish zone.
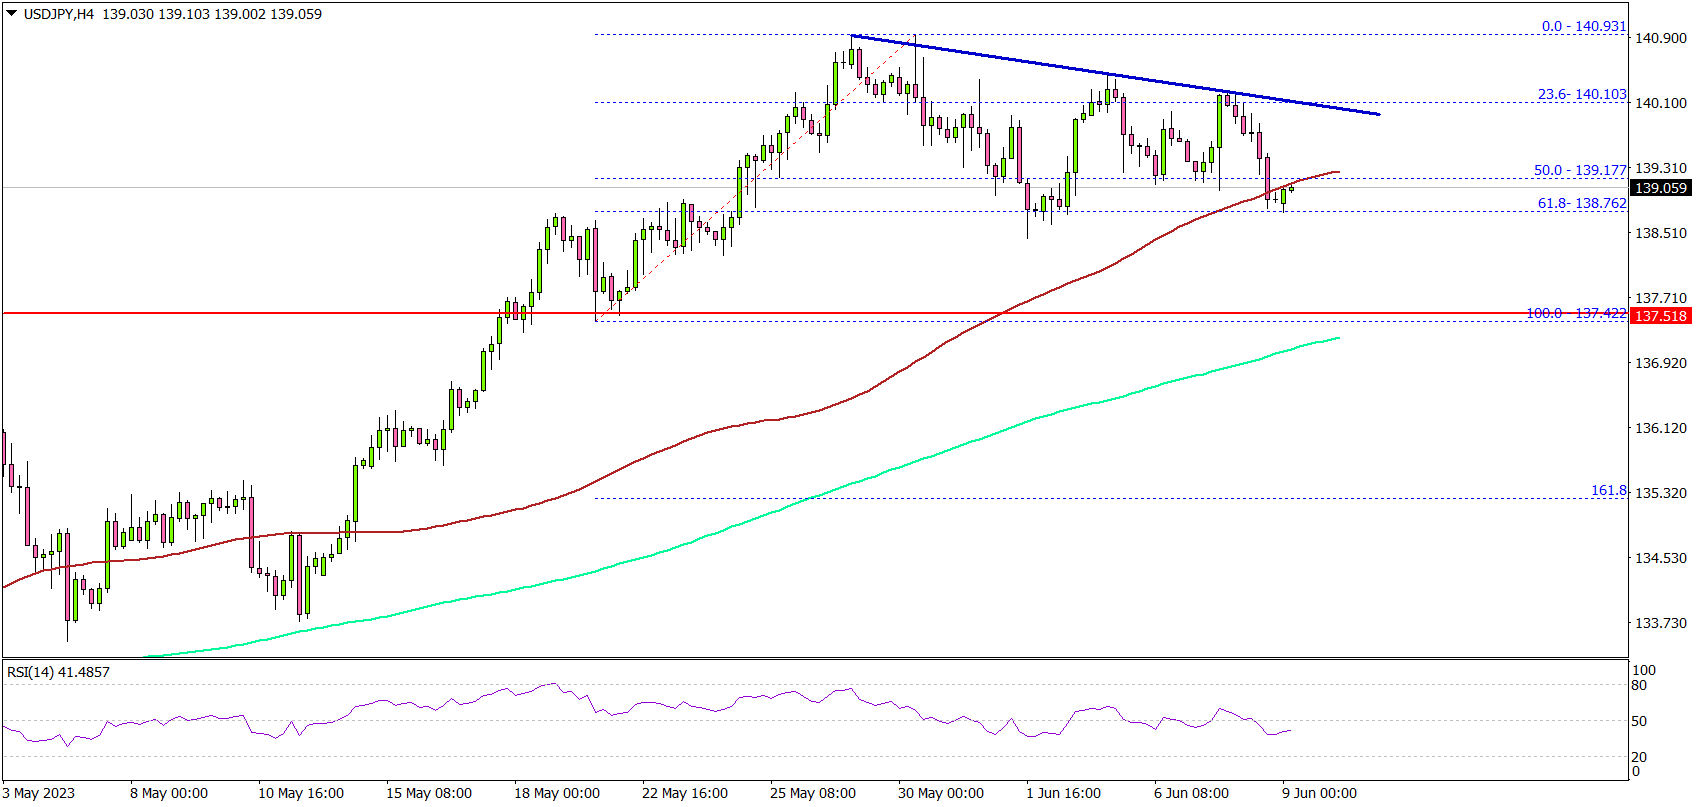
Looking at the 4-hour chart, the pair traded below the 139.50 support. There was a move below the 50% Fib retracement level of the upward move from the 137.42 swing low to the 140.93 high.
The pair tested the 100 simple moving average (red, 4 hours). There is also a bearish trend line forming with resistance near 140.00 on the same chart. Immediate support is near the 138.20 level. The next major support is near the 137.50 level.
If there is a downside break below the 137.50 support, the pair could decline toward the 137.00 support. If there is a fresh increase, the pair could face resistance near 140.00.
The first major resistance is near the 140.20 level. If there is a move above the 140.20 resistance, the pair could drift toward 141.00.
Looking at EUR/USD, the pair started a decent increase above the 1.0750 resistance and there could be a move above the 1.0820 resistance.
Economic Releases
- Canada’s employment Change for May 2023 – Forecast 23.2K, versus 41.4K previous.
- Canada’s Unemployment Rate for May 2023 – Forecast 5.1%, versus 5.0% previous.


