
- Dow Jones Industrial Average has underperformed against the S&P 500 and Nasdaq 100 in the past 2 sessions.
- Broke minor support yesterday now turns into key short-term resistance at 34,310.
- Sill sandwiched within a complex sideways range configuration in the medium-term horizon with its range resistance at 34,630.
The Dow Jones Industrial Average (DJIA) has continued to be one of the underperformers among the major US benchmark stock indices ex-post Q2 “Triple Witching” options expiration since last Friday, 16 June.
In the past two sessions, the DJIA has declined by -1.03% versus the S&P 500 (-0.84%), Nasdaq 100 (-0.76%), and small-cap concentrated Russell 2000 (-1.2%).
Sandwiched within a medium-term complex sideways range in the past 6 months
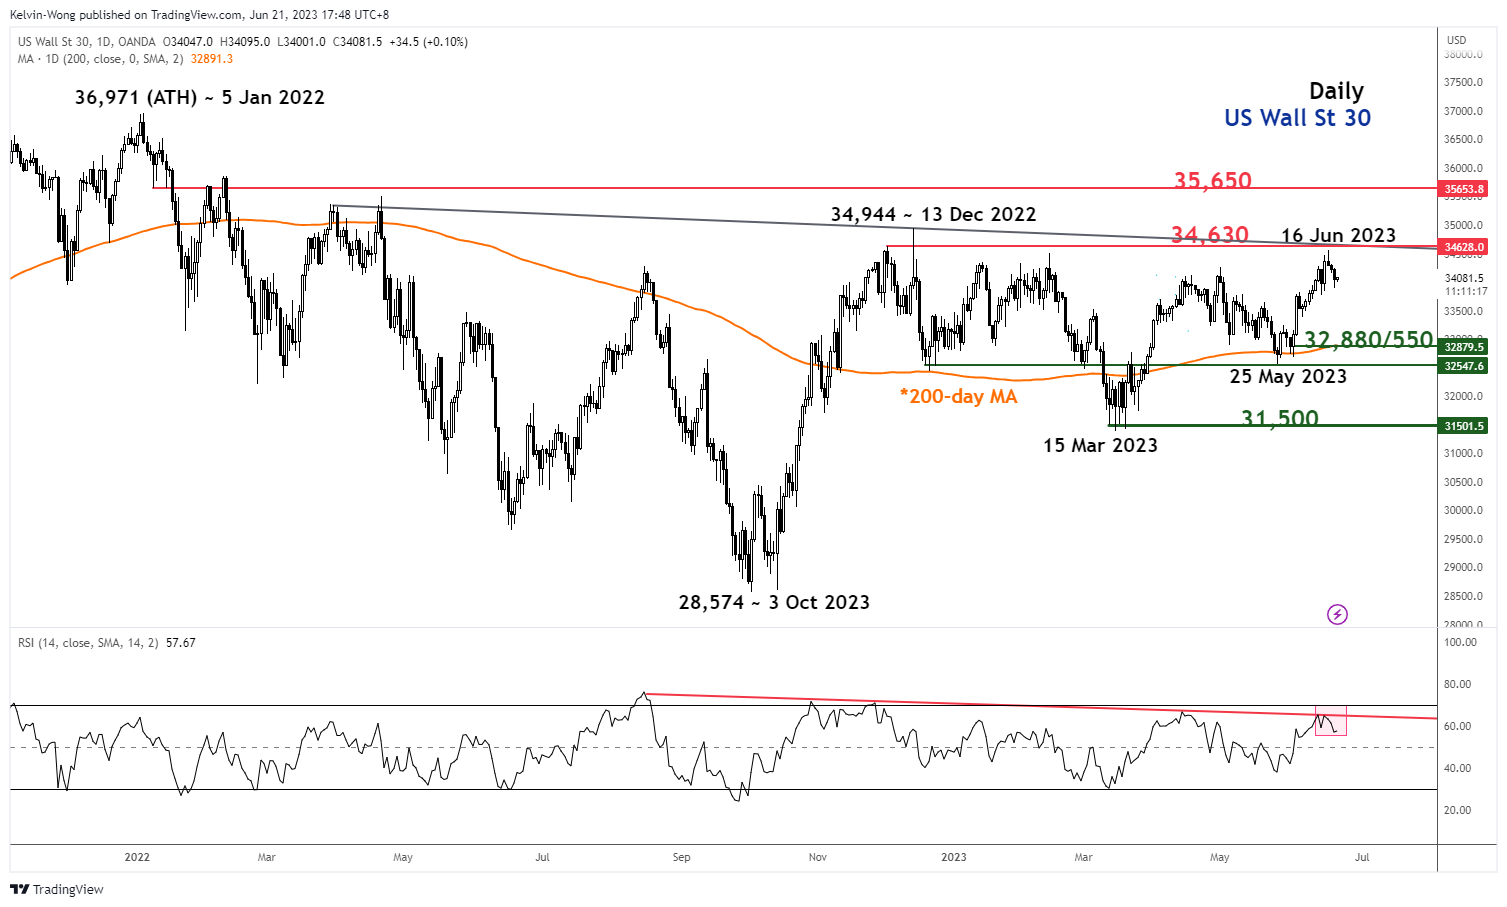
Fig 1: US Wall St 30 medium-term trend as of 21 Jun 2023 (Source: TradingView, click to enlarge chart)
The price actions of the US Wall St 30 Index (proxy of the Dow Jones Industrial Average futures) have continued to churn within a medium-term complex sideways range configuration in place since 13 December 2022. The recent minor up move from the 25 May 2023 low of 32,561 has managed to stage a retreat right below the upper boundary of the range configuration now acting as resistance at 34,630 (see daily chart).
Minor support broke but still above the 200-day moving average
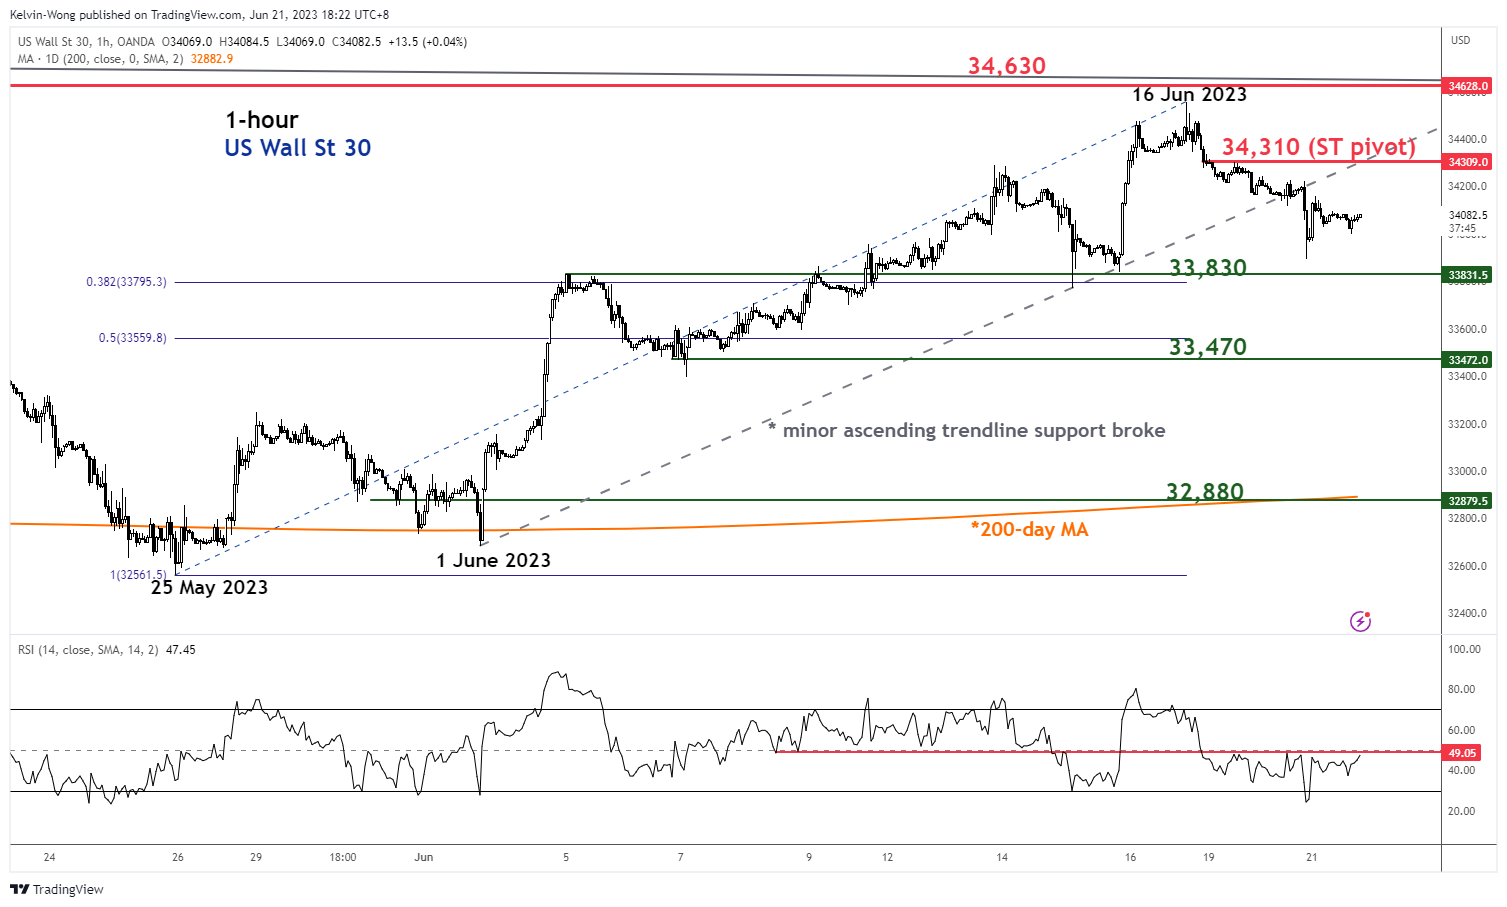
Fig 2: US Wall St 30 minor short-term trend as of 21 Jun 2023 (Source: TradingView, click to enlarge chart)
Yesterday, the Index has broken below its minor ascending trendline support from the 1 June 2023 low now acting as a pull-back resistance at around 34,310 which also confluences with the 61.8% Fibonacci retracement of the current minor decline from the 16 June 2023 high to yesterday, 20 June 2023 low (see 1-hour chart)
Short-term momentum is still showing no clear signs of a bullish reversal as indicated by the 1-hour RSI oscillator that is still below a corresponding resistance at the 49% level.
A break below the 33,830 near-term support exposes the next support at 33,470 (minor swing low area of 7 June 2023 & close to the 50% Fibonacci retracement of the prior up move from 25 May 2023 low to 16 June 2023 high).
On the flip side, a clearance above 34,310 key short-term pivotal resistance negates the bearish tone for the next resistance to come in at 34,630 (medium-term range top as illustrated on the daily chart).


 has continued to be one of the underperformers among the major US benchmark stock indices ex-post Q2 “Triple Witching” options expiration since last Friday, 16 June.)