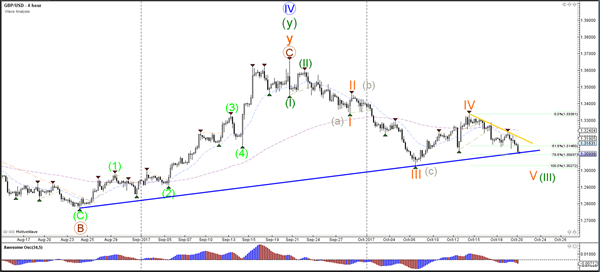
Currency pair GBP/USD
The GBP/USD is building lower lows and lower highs which makes a bearish ABC (grey) a bit less likely and a wave 123 (green) more probable, although a bearish breakout below support (blue) is still needed to confirm. The wave 4 (orange) correction is less likely if price breaks above the resistance trend line (yellow). A break below the support trend line (blue) increases the chance of a bearish break within wave 5 (orange).
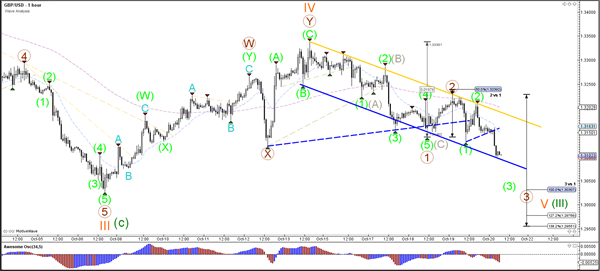
The GBP/USD broke the support trend lines (dotted blue) of the triangle chart pattern. Price will need to show bearish momentum and bear flag chart patterns to confirm a potential wave 3 impulse. Price would also need to break below the bottom of the bearish channel (blue).
Currency pair EUR/USD
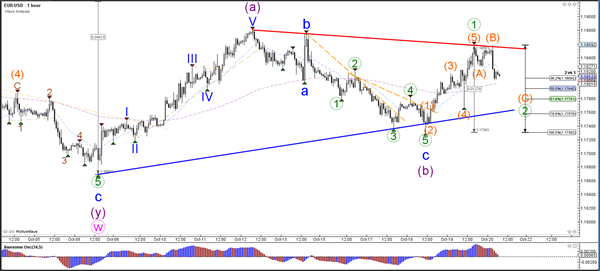
The EUR/USD bounced at resistance trend lines (orange) of the larger triangle chart pattern. A break above resistance would confirm a bullish breakout within wave C of wave X (pink). A break below the support trend line (blue) will probably indicate a larger correction within wave 4 (light purple).
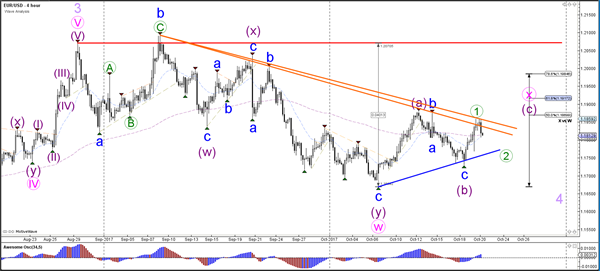
The EUR/USD could be building a wave 1-2 (green) if price stays above the 100% Fibonacci level of wave 2 vs 1.
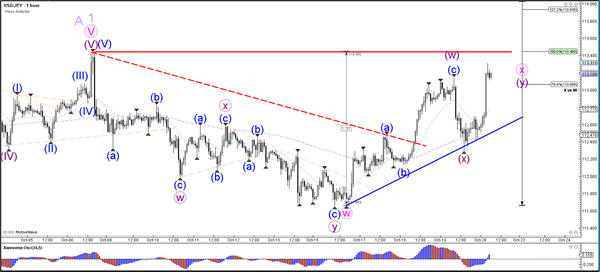
Currency pair USD/JPY
The USD/JPY stopped at the 78.6% Fibonacci resistance level but then failed to break below the support trend line which could either indicate a larger wave X (pink) or an uptrend continuation and an invalidation of the current wave patterns.
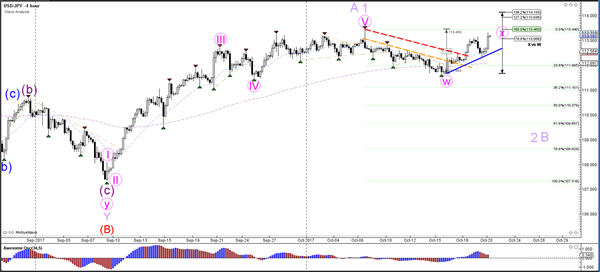
The USD/JPY is approaching the resistance from the previous top (red).