
- Nasdaq 100 outperformance over the Dow Jones Industrial Average (DJIA) since the start of the major uptrend phase has started to dissipate.
- A bullish rotation into the laggard, DJIA is considered a sign of a positive breadth development for the US stock market.
- Watch the key short-term support at 37,470.
Since our last analysis, the US Wall St 30 Index (proxy of the Dow Jones Industrial Average futures) has continued its march upwards as expected and hit a fresh all-time high of 37,855 yesterday, 2 January 2023. It ended yesterday’s US session with a small daily gain of +0.15%.
In contrast, the technology and growth-oriented mega “Magnificent 7” group of stocks that have a significant combined weightage of approximately 35% in the Nasdaq 100 sold off yesterday on the backdrop of negative news flows.
Barclays downgraded Apple to underweight for the first time since 2019 as it cited soft demand for the latest model of iPhone and a potential backlash on US semiconductors firms’ future sales to the Chinese market; the US White House may implement more stringent curbs on US semiconductors related exports to China as the leading Dutch semiconductor equipment maker, ASML has been pressured by the US Biden administration to cancel some of its top-end semiconductors peripherals (deep ultraviolet lithography machines) to China immediately ahead of export bans on the high-end chipmaking equipment came into effect.
The Nasdaq 100 was the worst performer among the major benchmark US stock indices yesterday with a daily loss of -1.7% versus the S&P 500 (-0.6%), and small-cap Russell 2000 (-0.7%).
The current major uptrend phases of the S&P 500, Nasdaq 100, and Dow Jones Industrial Average started in early October 2022 and the Nasdaq 100 has led the fort. Before yesterday’s sell-off in the “Magnificent 7”, the Nasdaq 100’s outperformance has started to dissipate since the start of November 2023 (see Fig 1).
Bullish rotation into the laggards; Dow Jones Industrial Average & Russell 2000
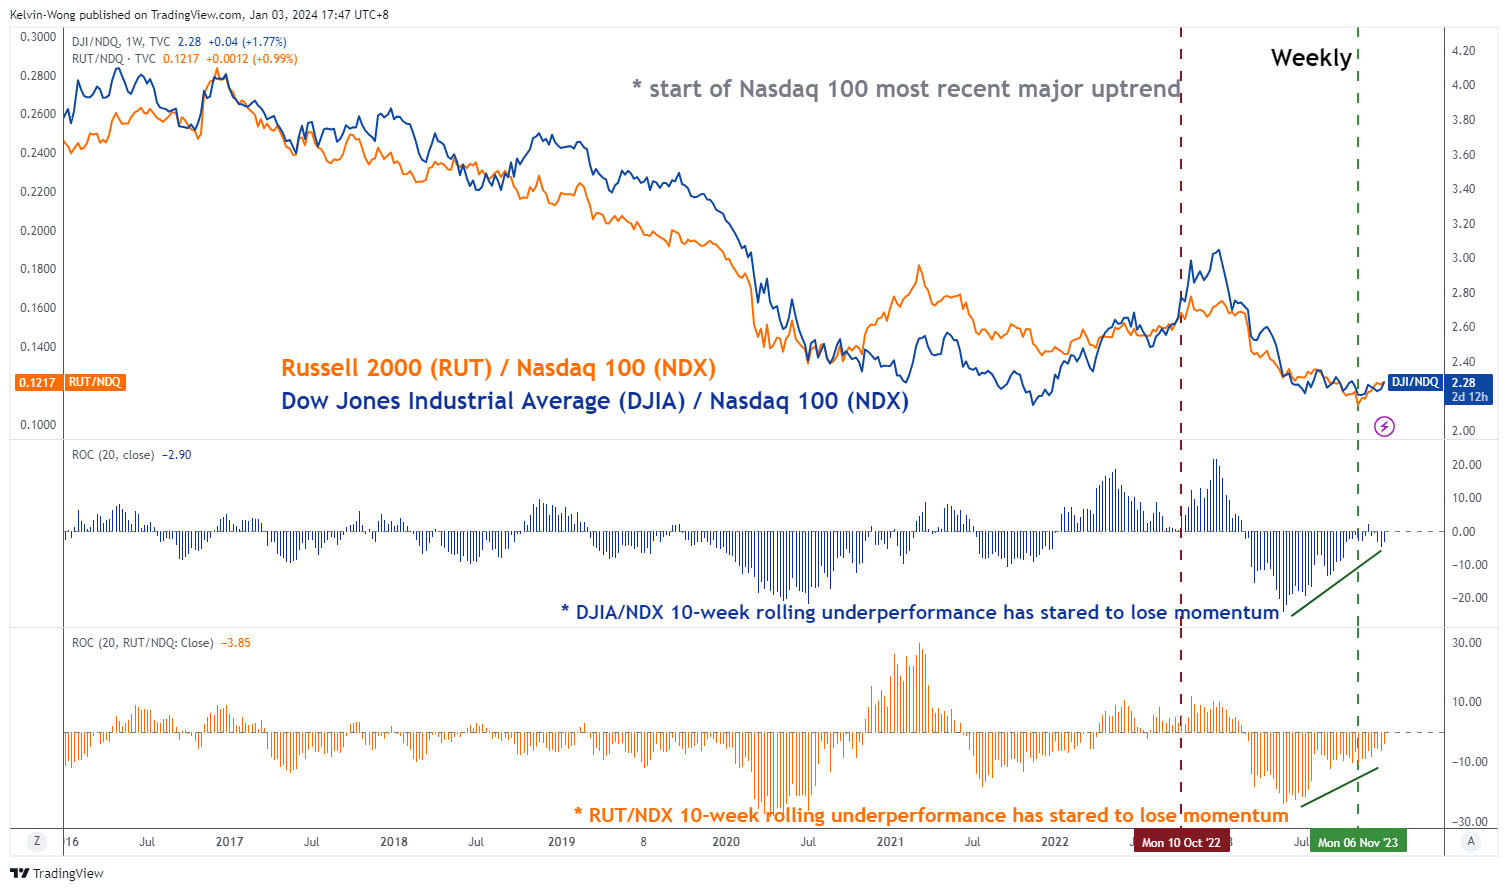
Fig 1: Ratio charts of DJIA & Russell 200 over Nasdaq 100 as of 2 Jan 2024 (Source: TradingView, click to enlarge chart)
The ratio chart of the Dow Jones Industrial Average (DJIA)over the Nasdaq 100 started to tick up on 6 November 2023 with its 10-week rolling underperformance measured by the ratio’s rate of change that has started to lose downside momentum which suggests a potential looming outperformance of DJIA over the Nasdaq 100.
This current movement of bullish rotation into the laggards of the US stock market is considered a healthy sign of improving breadth as the heavily concentrated leadership of the “Magnificent 7” that rode on the coat-tail of the “AI productivity” theme play is being dissipated which reduces the odds of the ongoing major uptrend phases in the US benchmark stock indices from turning in a frothy climatic melt-up.
Sell-off stalled at minor channel support
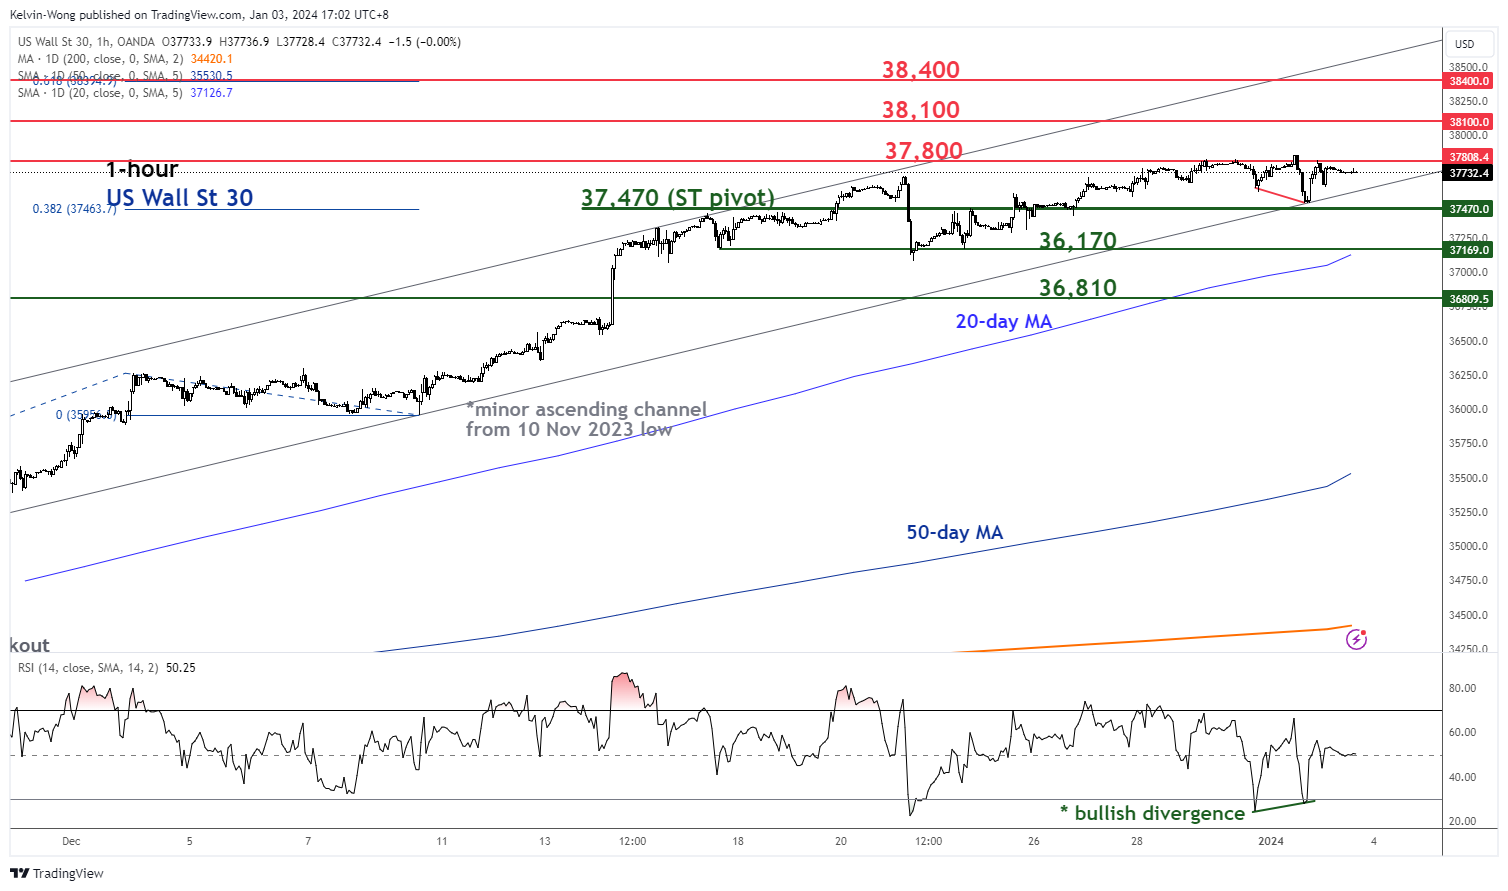
Fig 2: US Wall St 30 minor short-term trend as of 3 Jan 2024 (Source: TradingView, click to enlarge chart)
Yesterday’s intraday decline of – 0.9% in the US Wall St 30 Index has managed to stall at the lower boundary of its minor ascending channel in place since the 10 November 2023 low.
In conjunction, the hourly RSI momentum indicator has flashed out a bullish divergence condition at its oversold region which suggests a slowdown in bearish momentum that may lead to bullish inflection to kickstart the next impulsive upmove sequence in price actions.
Watch the 37,470 key short-term pivotal support and a clearance above 37,800 sees the next intermediate resistances coming in at 38,100 and 38,400 (upper boundary of the minor ascending channel & a cluster of Fibonacci extension levels).
On the flip side, failure to hold at 37,470 negates the bullish tone for a minor corrective decline towards the next immediate supports at 36,170 (also the 20-day moving average), and 36,810 (former all-time swing high area of 5 January 2022).


over the Nasdaq 100 started to tick up on 6 November 2023 with its 10-week rolling underperformance measured by the ratio’s rate of change that has started to lose downside momentum which suggests a potential looming outperformance of DJIA over the Nasdaq 100.)