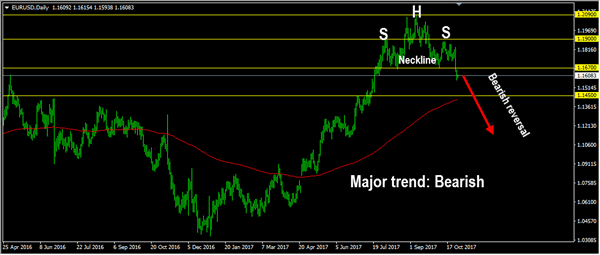
EURUSD
The EURUSD had a significant bearish momentum last week, broke below the “neckline” of the “head and shoulders” formation as you can see on my daily chart below. This fact confirms the bearish reversal scenario with nearest target seen at 1.1450. The bias is bearish in nearest term. Immediate resistance is seen around 1.1650/70 area. A clear break above that area could lead price to neutral zone in nearest term testing 1.1725 area but as long as stay below 1.1900 I remain bearish and any upside pullback should be seen as a good opportunity to sell.
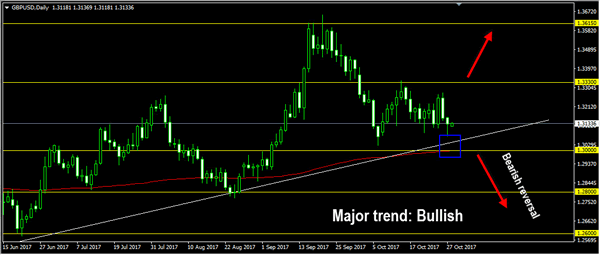
GBPUSD
The GBPUSD was indecisive last week. The bias is neutral in nearest term probably with a little bearish bias testing the trend line support and daily EMA 200 located around 1.3000 region which remains a good place to buy with a tight stop loss. Immediate resistance is seen around 1.3162. A clear break above that area could trigger further bullish pressure testing 1.1.3225 area. On the downside, a clear break and daily close below 1.3000 would stop the major bullish trend and could be an early signal of a bearish reversal scenario with nearest target seen at 1.2800 area.
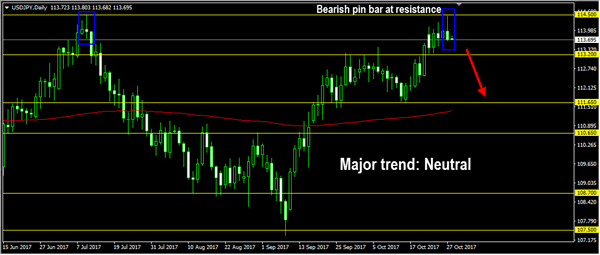
USDJPY
The USDJPY was indecisive last week. Price printed a bearish pin bar formation near 114.50 key resistance as you can see on my daily chart below suggests a potential bearish view. The bias is bearish in nearest term testing 113.20 support area. A clear break below that area would expose 112.50 or lower. On the upside, 114.50 remains a key resistance and good place to sell with a tight stop loss as a clear break above that area would expose 115.50 or higher. Overall I remain neutral.
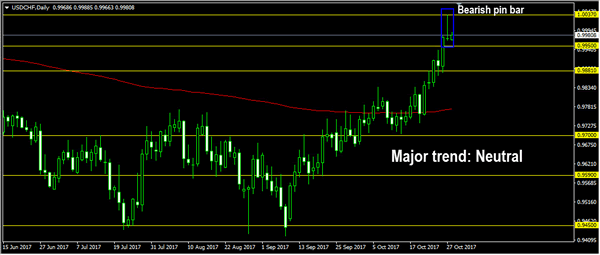
USDCHF
The USDCHF continued to trade higher last week topped at 1.0037 but closed lower at 0.9971. I still prefer a bullish scenario at this phase but we have a bearish pin bar formation as you can see on my daily chart below suggests a potential bearish pullback. The bias is neutral in nearest term. Immediate support is seen around 0.9950. A clear break below that area could trigger further bearish pressure testing 0.9910 – 0.9881 area. Immediate resistance is seen around 1.0037. A clear break above that area would nullify the bearish pin bar scenario targeting 1.0100 or higher. Overall I remain neutral.