
Bullish Scenario: Buy between 17515 and 17600 with TP1: 17681; TP2: 17720 intraday, and TP3: 17750 / 18000 in extension. It is recommended to set a stop loss (S.L.) below 17487 or at least 1% of the account capital**.
Bearish Scenario in case of breaking the buying zone: Sell below 17500 with TP1: 17469; TP2: 17421, and TP3: 17358 in extension. It is recommended to place a stop loss at 1.3477 or at least 1% of the account capital**. A trailing stop can be used.
Fundamental Environment:
The US 100 has risen approximately 9% since its January 5th low, following the increases of over 12% in November and over 8% in December, mainly driven by speculation about the Fed’s early start to monetary easing (rate cuts).
Despite several FOMC members continuing to discourage speculation, the fourth-quarter earnings season of 2023 and the earnings of technology companies temporarily shifted previous speculations.
With the Fed meeting next week, market expectations are expected to become more realistic, acknowledging that the first-rate cuts will likely have to wait until at least the end of the first half of the year, triggering the necessary correction before incorporating the cuts into the price for June.
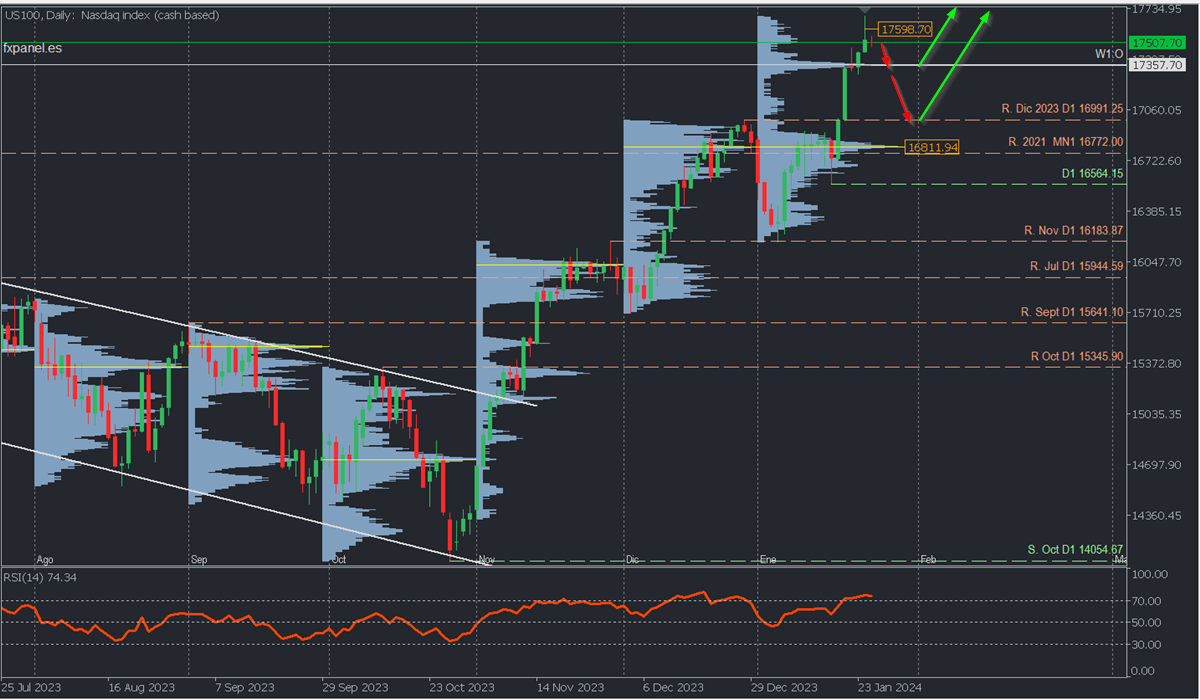
Analysis from the daily chart:
So far, the index reached a high of 17681.82 yesterday with no references to volume-based buying target levels. We can exclusively consider on the daily chart the potential retracement zones due to liquidity, such as the weekly opening at 17357.70 with a high volume node becoming the main target for bears in the short term. Its breakout will extend the correction towards the December broken resistance, now acting as support at 16991.25, and more extensively a retest of the January buying zone around the uncovered POC at 16811.94 and surrounding areas. A renewed rally is expected to reach and surpass 18000 before the end of the month.
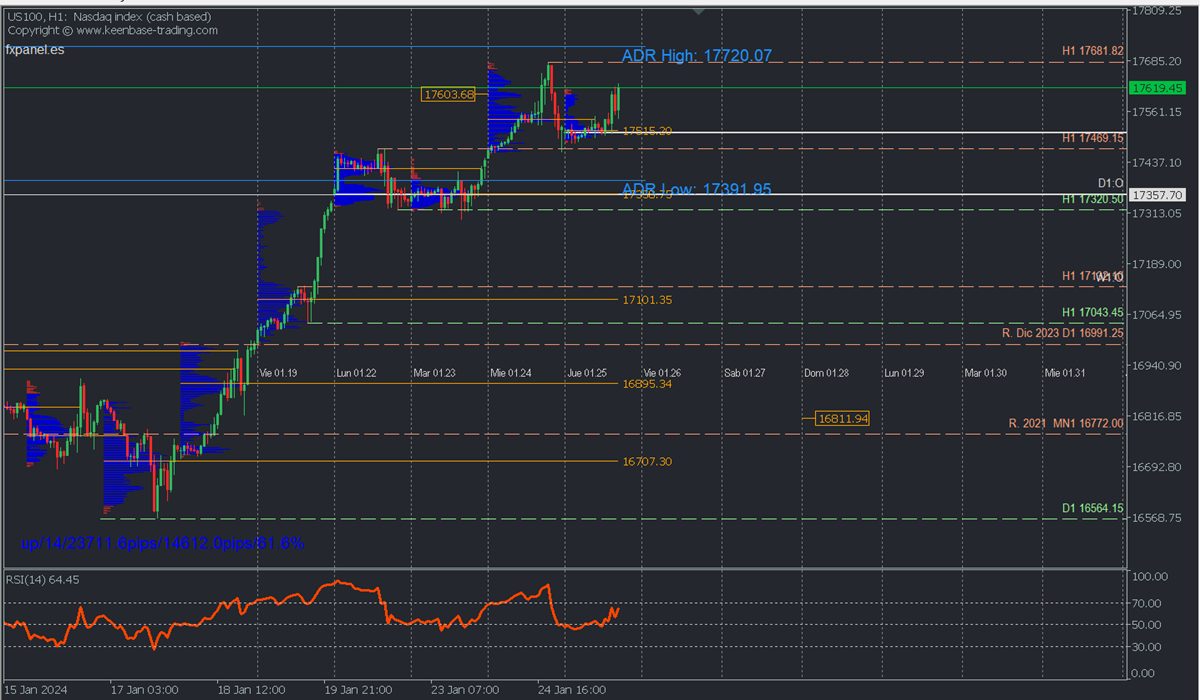
Analysis from H1 chart:
The price could continue to rise today and break the resistance level at 17681.82. However, it may be limited by the daily bullish average range at 17720.07 before continuing to increase further towards 18,000 in the upcoming days. This will happen at least before the Fed meeting.
This scenario will remain valid as long as the retracement stays above the buying zone that coincides with the day’s opening at 17515, even after a retracement to it. On the other hand, if the price fails to create a new high above the resistance at 17681.82 and falls towards the buying zone, causing its decisive breakout, it will pave the way for a possible breakdown of the support at 17460, in which case we will have a more extended correction towards the next buying zone at the weekly opening at 17358.
The bullish trend will maintain its intact structure as long as the retracements do not break the last relevant support, currently at 16564.15.
*Uncovered POC: POC = Point of Control: It is the level or zone where the bullish trend will remain intact as long as retracements do not break the relevant support at 16564.15. highest volume concentration occurred. If there was a bearish movement previously from it, it is considered a selling zone and forms a resistance area. Conversely, if there was a bullish impulse previously, it is considered a buying zone, usually located at lows, forming support zones.
**Consider this risk management suggestion.
**It is crucial that risk management be based on capital and traded volume. Therefore, a maximum risk of 1% of the capital is recommended. Using risk management indicators like the Easy Order is suggested.


.)