
Bearish Scenario: Sales below 78.99 with TP1: 77.93, TP2: 77.45, and upon its breakout TP3: 76.56 and TP4: 75.70. It is recommended to place a stop loss above 79.50, at least 1% of the account capital**. A trailing stop can be used.
Bullish Scenario: Purchases above 78.00 (wait for a pullback to this area) with TP1: 1679.00 (uncovered POC*), TP2: 79.33, and TP3: 79.66 intraday. It is recommended to set a stop loss (S.L.) below 77.40 or at least 1% of the account capital**.
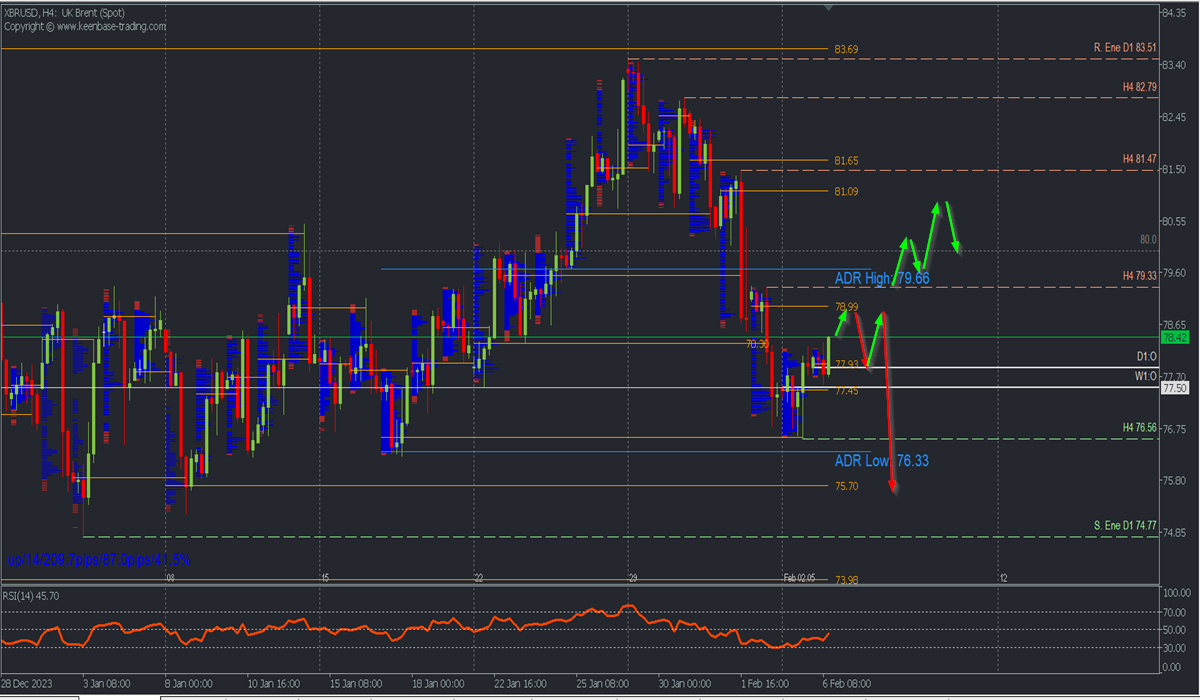
Scenario from the H4 chart
After reaching a buying zone from three weeks ago at the uncovered POC* 76.57, the price reacts upwards and corrects towards the last selling zone at Friday’s uncovered POC* at 78.99, leaving active two POCs at 77.93 and 77.45, as intraday buying (demand) zones.
From a structural point of view, the last relevant resistance is located at 79.33, implying that as long as this level remains intact, the sequence will continue to be bearish.
With purchases above the level 78.62, forming a local H1 support, extension towards 78.99 is expected, from where bears are expected to be reactivated for a new decline at least towards 77.93 and 77.45/50, already indicated demand zones, with a moderate bullish rebound, after which a bearish continuation and decisive breakout are expected, which will pave the way for bears to extend the decline towards the support 76.56 and the next uncovered POC at 75.70.
On the other hand, a bullish continuation will imply a trend reversal if there is a broad rebound from the buying zones 77.93 and 77.45 and the consequent decisive breakout of the selling zone and resistance 79.33.
The RSI remains in negative territory and is ascending towards the midpoint, indicating the possible culmination of the corrective ascent once the supply zone is reached.
*Uncovered POC: POC = Point of Control: It is the level or zone where the highest volume concentration occurred. If there was previously a bearish movement from it, it is considered a selling zone and forms a resistance zone. On the contrary, if there was previously a bullish impulse, it is considered a buying zone, usually located at lows, thus forming support zones.
**Consider this risk management suggestion
**It is very important that risk management be based on capital and traded volume. Therefore, a maximum risk of 1% of the capital is recommended. It is suggested to use risk management indicators such as Easy Order.


