
- US 30 index in bearish mode in very short-term
- MACD and stochastics indicate negative correction
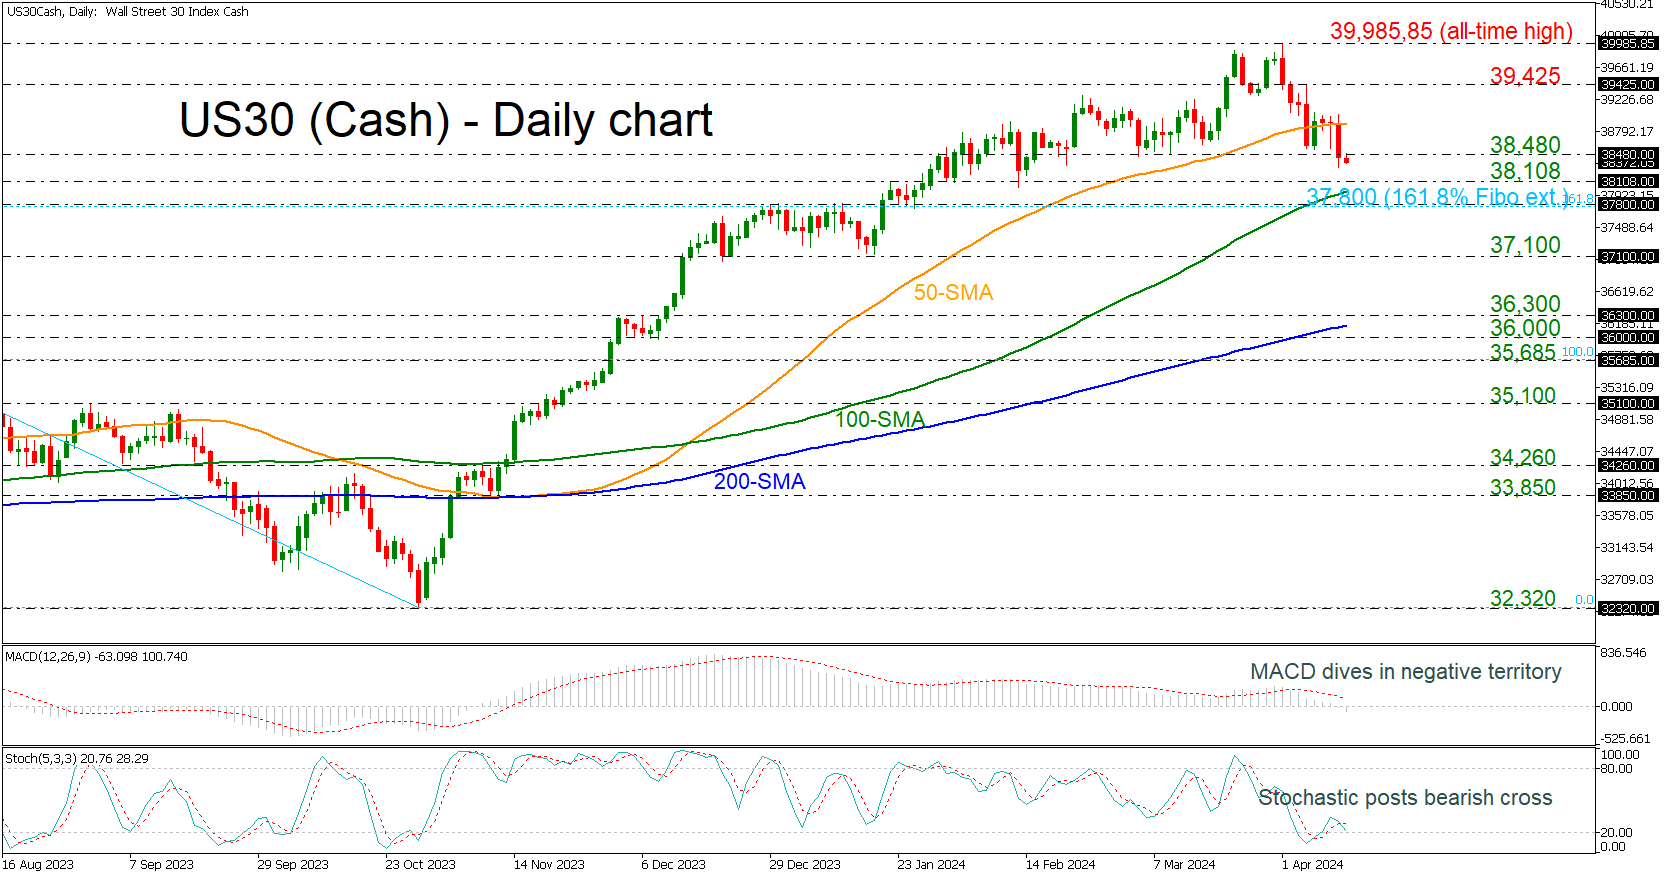
The US 30 cash index has lost its positive momentum after the pullback from the all-time high of 39,985.85, easing beneath the 50-day simple moving average (SMA). In the short-term, the market could retain the range-bound trading as the MACD is falling beneath its trigger and zero lines, while the stochastic posted a bearish crossover.
Should the pair stretch south, the 38,108 level could provide immediate support before the index touches the 20-day SMA at 37,950 barrier. A step lower could hit the 37,800 barrier ahead of the 37,100 area.
On the flip side, the 50-day SMA at 38,900 may halt upside movements but a successful climb above it could open the way for a retest of the 39,425 resistance and the record peak of 39,985.85.
In the very short-term picture, the index has been trading in a bearish mode for the past couple of weeks. However, in the broader outlook the tendency is still positive.


. In the short-term, the market could retain the range-bound trading as the MACD is falling beneath its trigger and zero lines, while the stochastic posted a bearish crossover.)