
- USDCAD may retest the uptrend line
- MACD and RSI lose steam
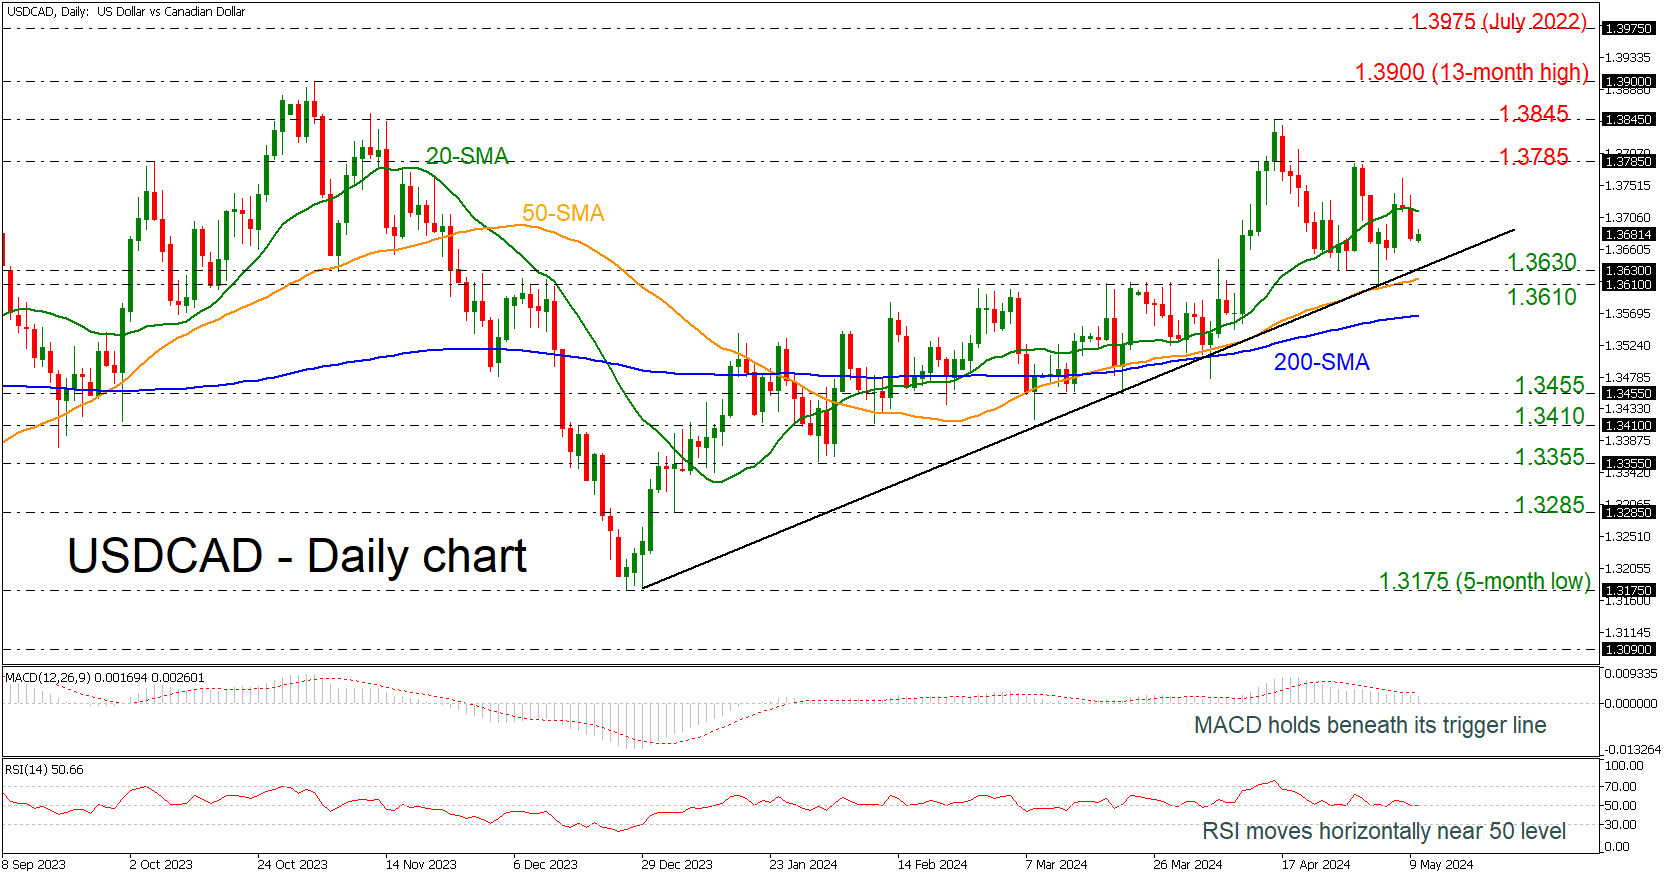
USDCAD is sliding beneath the 20-day simple moving average (SMA) and is approaching the medium-term ascending trend line around the 1.3630-1.3610 support region.
Technically, the MACD oscillator is holding beneath its trigger line in the positive area; however, the RSI is weakening and is moving horizontally near the neutral threshold of 50.
In case of steeper decreases the market may rest near the 50-day SMA at 1.3618 and any movements below the 1.3610 region could open the way for challenging the 200-day SMA at 1.3565. Even lower, the outlook could switch to negative, hitting the 1.3455 hurdle.
On the other hand, a climb beyond the 20-day SMA could endorse the bullish structure, meeting the immediate resistance at 1.3785 and the previous peak of 1.3845. If the bulls extend the bullish move, then the price could rally towards the 13-month high of 1.3900.
Summarizing, the current picture of USDCAD is positive unless the price plunges below the 200-day SMA.


 and is approaching the medium-term ascending trend line around the 1.3630-1.3610 support region. )