
 shows that:→ the price has been forming an ascending channel since 19 April (shown in blue);→ bulls failed to hold above the March high around the 5285 level (a bearish sign);)
Yesterday, S&P Global reported its Purchasing Managers’ Index (PMI) values for the US, which exceeded expectations. According to ForexFactory:
→ Manufacturing PMI: actual = 50.9; expected = 50.0; previous = 50.0.
→ Services PMI: actual = 54.8 (the highest value since May 2023); expected = 51.2; previous = 51.3.
However, the high PMI values, indicating a healthy economy, led to a drop in the stock index. The S&P 500 index (US SPX 500 mini on FXOpen) fell by more than 1.5% following the publication.
What explains this case of “good news is bad news”?
The point is, amid high business activity, manufacturers reported rising prices for a range of resources, suggesting that goods inflation might strengthen in the coming months. Stock market participants might have interpreted this as a reason for the Federal Reserve to maintain high rates for a longer period – hence the sharp decline in the index.
“Companies remain cautious with respect to the economic outlook amid uncertainty over the future path of inflation and interest rates, and continue to cite worries over geopolitical instabilities and the presidential election,” said Chris Williamson, Chief Business Economist at S&P Global Market Intelligence, in an interview with Reuters.
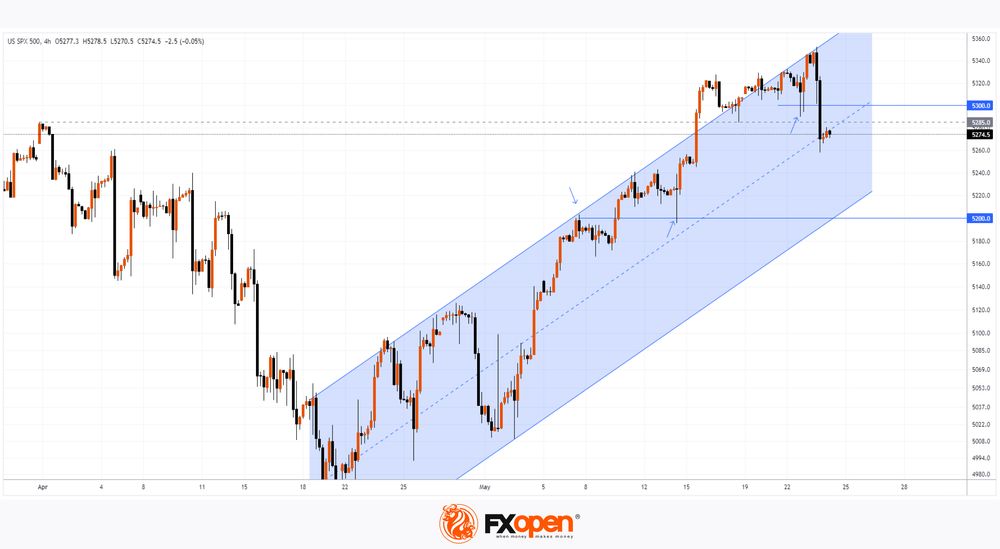
Technical analysis of the S&P 500 chart today (US SPX 500 mini on FXOpen) shows that:
→ the price has been forming an ascending channel since 19 April (shown in blue);
→ bulls failed to hold above the March high around the 5285 level (a bearish sign);
→ the psychological level of 5300, which showed signs of support this week, has now been breached and may act as resistance. Conversely, the 5200 level, after being breached, has shifted its role from resistance to support (as indicated by arrows).
So far, the bearish momentum that emerged yesterday following the PMI news release is being contained at the median line of the blue channel. But if sentiment does not change today, the median might be breached, and then the path to the lower boundary of the channel will open for the S&P 500 price (US SPX 500 mini on FXOpen).
Trade global index CFDs with zero commission and tight spreads. Open your FXOpen account now or learn more about trading index CFDs with FXOpen.
This article represents the opinion of the Companies operating under the FXOpen brand only. It is not to be construed as an offer, solicitation, or recommendation with respect to products and services provided by the Companies operating under the FXOpen brand, nor is it to be considered financial advice.