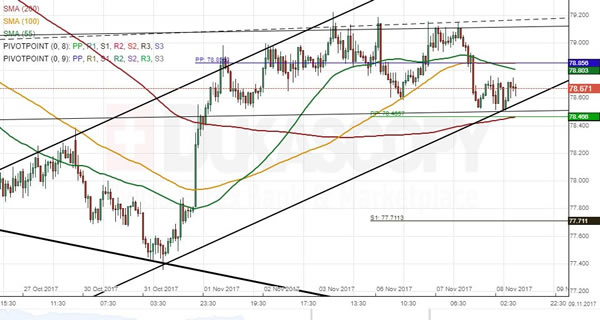
NZD/JPY has been trading in three channels simultaneously. The dominant pattern began already mid-September, while the two junior ones have confined its latest up-wave. It should be noted that the pair has made a retracement from a long-term ascending triangle (drawn with the dashed line). This suggests that the New Zealand Dollar might be pressured southwards during the following week or two. This is likewise confirmed by the rate’s failure to reach the upper boundary of the both junior formations. A possible downside target during the following week might be the five-month low of 77.40. This movement lower might likewise continue even further until the bottom channel boundary circa 76.50 where the monthly S1 and the weekly S2 are located. Conversely, the Kiwi might also test the upper channel boundary near the 79.50 mark; however, the subsequent movement should be southwards.