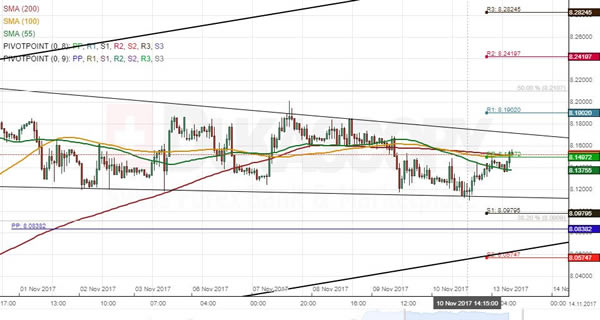
After reaching the 2016/2017 low of 7.7050 on September 8, USD/NOK started a period of recovery in an ascending channel. If looking at the current situation, the pair’s latest wave down began two weeks ago and it is gradually leading the US Dollar towards the bottom boundary of the previously-mentioned channel. This movement has been stranded in a falling wedge. From a theoretical point of view, all indications point to a soon breakout north. Given that the pair retraced from the 50.0% Fibo, the Greenback might still push slightly lower down to the 8.09 area where the 38.2% Fibo and the weekly S1 are located. However, the rate’s subsequent movement should be to the upside. Meanwhile, the steepness of the channel up is unlikely to hold for long now, and thus the pair could eventually break the bottom boundary of this pattern—most probably during next week. A medium-term upside target is expected to be the weekly R1 at 8.3168.