
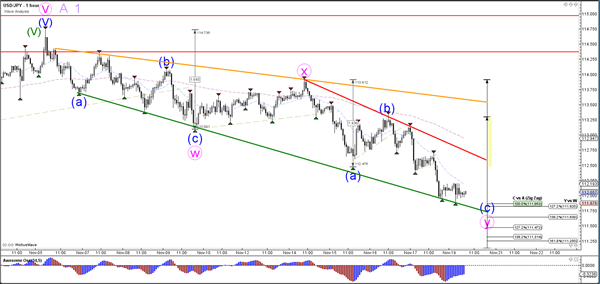
Currency pair USD/JPY
The USD/JPY is approaching a 38.2% Fibonacci support level and potential bounce spot. A failure for price to break above resistance could still indicate an extension of the bearish correction towards lower Fibonacci levels like the 50% Fib.
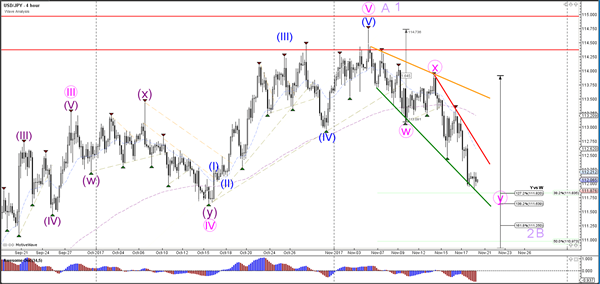
The USD/JPY is testing the support trend line (green) which could cause price to bounce back to the top of the channel resistance (red). Price seems to be building a falling wedge chart pattern as well, which is another factor that could create a bullish response.
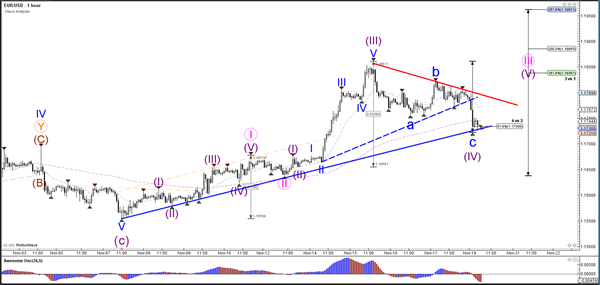
Currency pair EUR/USD
EUR/USD is retesting the support trend line (blue). A break below the support could indicate a failure to continue the uptrend and makes an ABC more likely than a 123 (pink) pattern, which in turn could mean that the wave 4 (light purple) is still active.
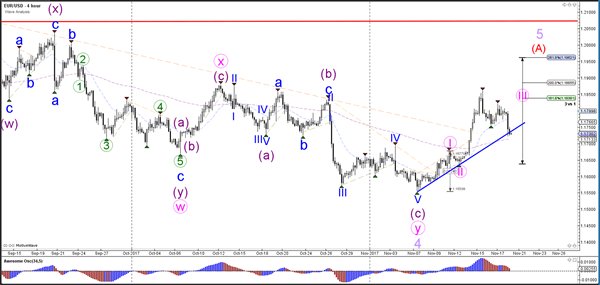
The EUR/USD potential breakout aboveresistance (red) could indicate a continuation of the uptrend within a wave 5 (purple) of wave 3 (pink). A push below the 61.8% Fib makes a wave 4 less likely.
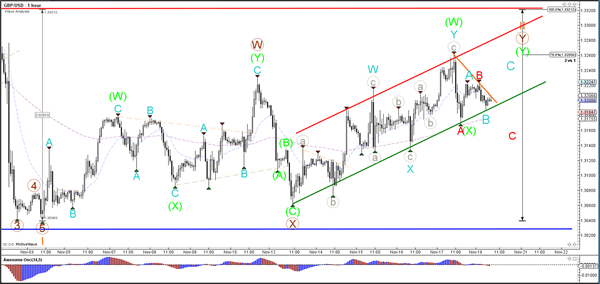
Currency pair GBP/USD
The GBP/USD is building a bullish channel (red/green) within the sideways range (red/blue). A breakout above the top (100% Fib) or below the support (blue) is needed before a new trend can be expected.
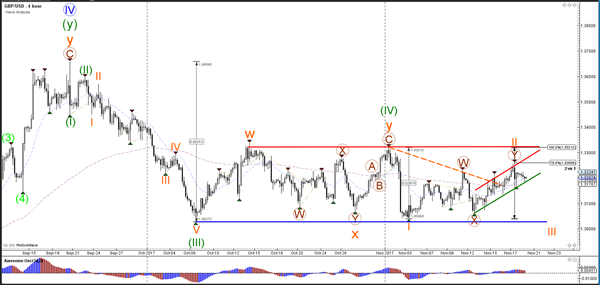
The GBP/USD is either expanding itsWXY complex correction (green) via a new ABC (blue) or price will break below the channel support (green) and build a bearish zigzag (red).


