
Fundamental Analysis
Japanese Yen Strength
- The JPY remains supported by rising expectations that the Bank of Japan (BoJ) will continue its rate hike cycle.
- Recent statements from Governor Kazuo Ueda and Deputy Governor Himino reinforce the possibility of further adjustments if inflation and growth align with projections.
- The 10-year Japanese bond yield has reached levels not seen since 2010, reflecting expectations of a more restrictive monetary policy.
US Dollar Weakness & Policy Divergence
- The USD is under pressure due to expectations that the Federal Reserve (Fed) will maintain its current stance and eventually cut rates in 2025.
- The narrowing interest rate differential between Japan and the US has favoured capital flows into the JPY.
- The release of the FOMC minutes will be key in determining the USD/JPY direction, as they may provide clearer signals about the Fed’s future monetary policy.
Geopolitical Factors & Market Sentiment
- The recent meeting between US and Russian officials in Saudi Arabia to discuss the war in Ukraine could impact global risk perception.
- A delay in implementing new US tariffs has fueled a higher appetite for risk, limiting the JPY’s demand as a safe-haven asset.
- Despite these factors, the current USD/JPY trend suggests resistance to further upside while the BoJ continues tightening its policy.
Technical Analysis
USD/JPY – H4
- Supply Zones (Sell): 152.64 // 154.22 // 155.25
- Demand Zones (Buy): 151.76
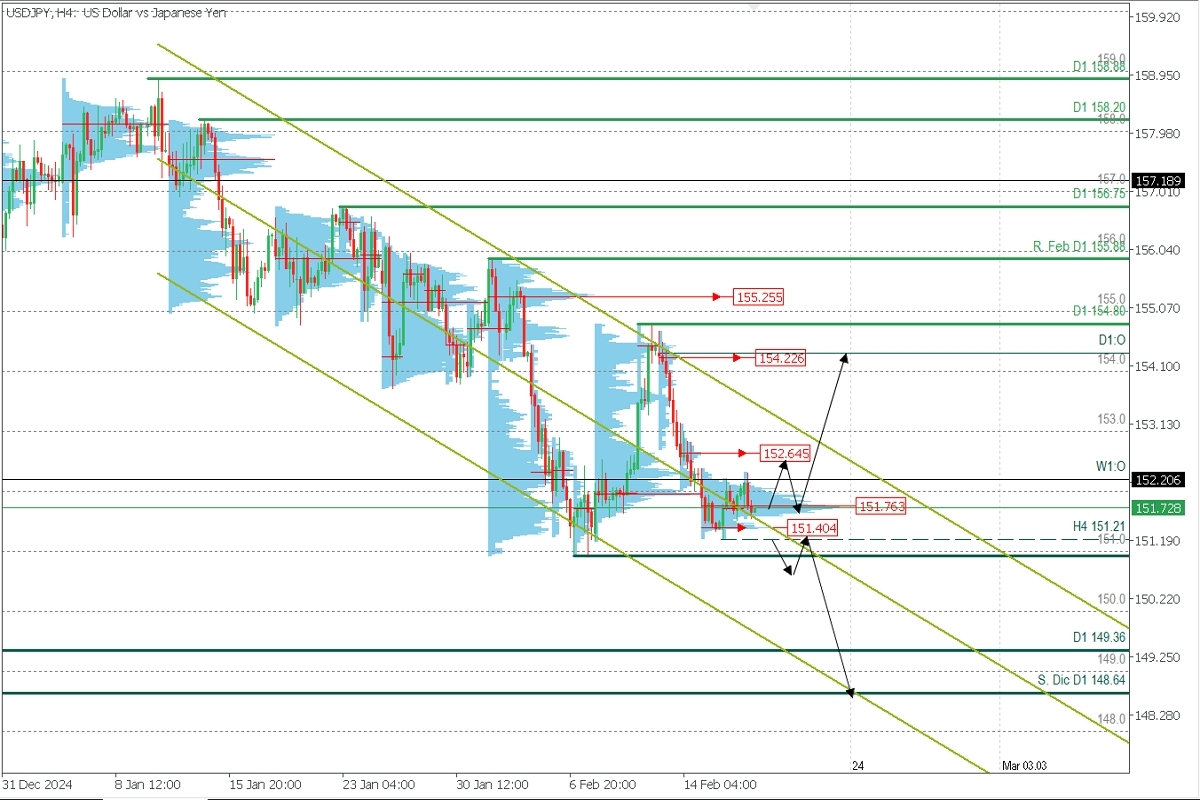
- The pair has been in a bearish phase since January, with the last validated daily resistance at the February high of 155.88.
- This structure is contained within a descending linear regression channel, with weekly volume concentrations at higher levels, confirming clear supply zones (sell).
- However, a moderate shift has been observed since last week when a lower POC formed around 151.96 and was slightly broken with minimal downside.
- Price consolidation around 151.76 suggests a potential reversal scenario.
- A decisive break above the upper channel limit would be the first sign of bullish exhaustion, confirmed by breaking the last validated daily resistance at 155.88.
- If the price drops below 151.00, the bullish scenario will be invalidated, and the 154.80 level (last validated daily resistance) will act as a reference for a potential trend shift.
Technical Summary
Bullish Scenario:
- Buy opportunities above the weekly volume concentration at 151.76, targeting the daily POC at 152.64, from where a pullback towards 151.76 may occur.
- A decisive break above 152.64 could extend the rally towards 154.00 and 154.22.
Bearish Continuation Scenario:
- A decisive break below 151.76 and 151.40 would signal stronger bearish control, confirmed by breaking the 151.21 support.
- In this case, selling pressure could extend towards 150.00 and 149.00, the December lows.
Always wait for the formation and confirmation of an Exhaustion/Reversal Pattern (ERP) on M5 before entering a trade in the key zones indicated.
Discovered POC:
- POC = Point of Control: The level or zone where the highest volume concentration occurred.
- If a bearish move originated from this level, it is considered a sell zone (resistance).
- If a bullish impulse originated from this level, it is considered a buy zone (support)


 will continue its rate hike cycle. Recent statements from Governor Kazuo Ueda and Deputy Governor Himino reinforce the possibility of further adjustments if inflation and growth align with projections.)