Hello fellow traders. In this technical article we’re going to look at the Elliott Wave charts of EURUSD Forex pair published in members area of the website. As our members know, EUR/USD is undergoing a three-wave pullback against the March 26th low. Recently, we forecasted the decline in the pair following a three-wave bounce. In the following text, we’ll explain the Elliott Wave analysis and outline the target areas.
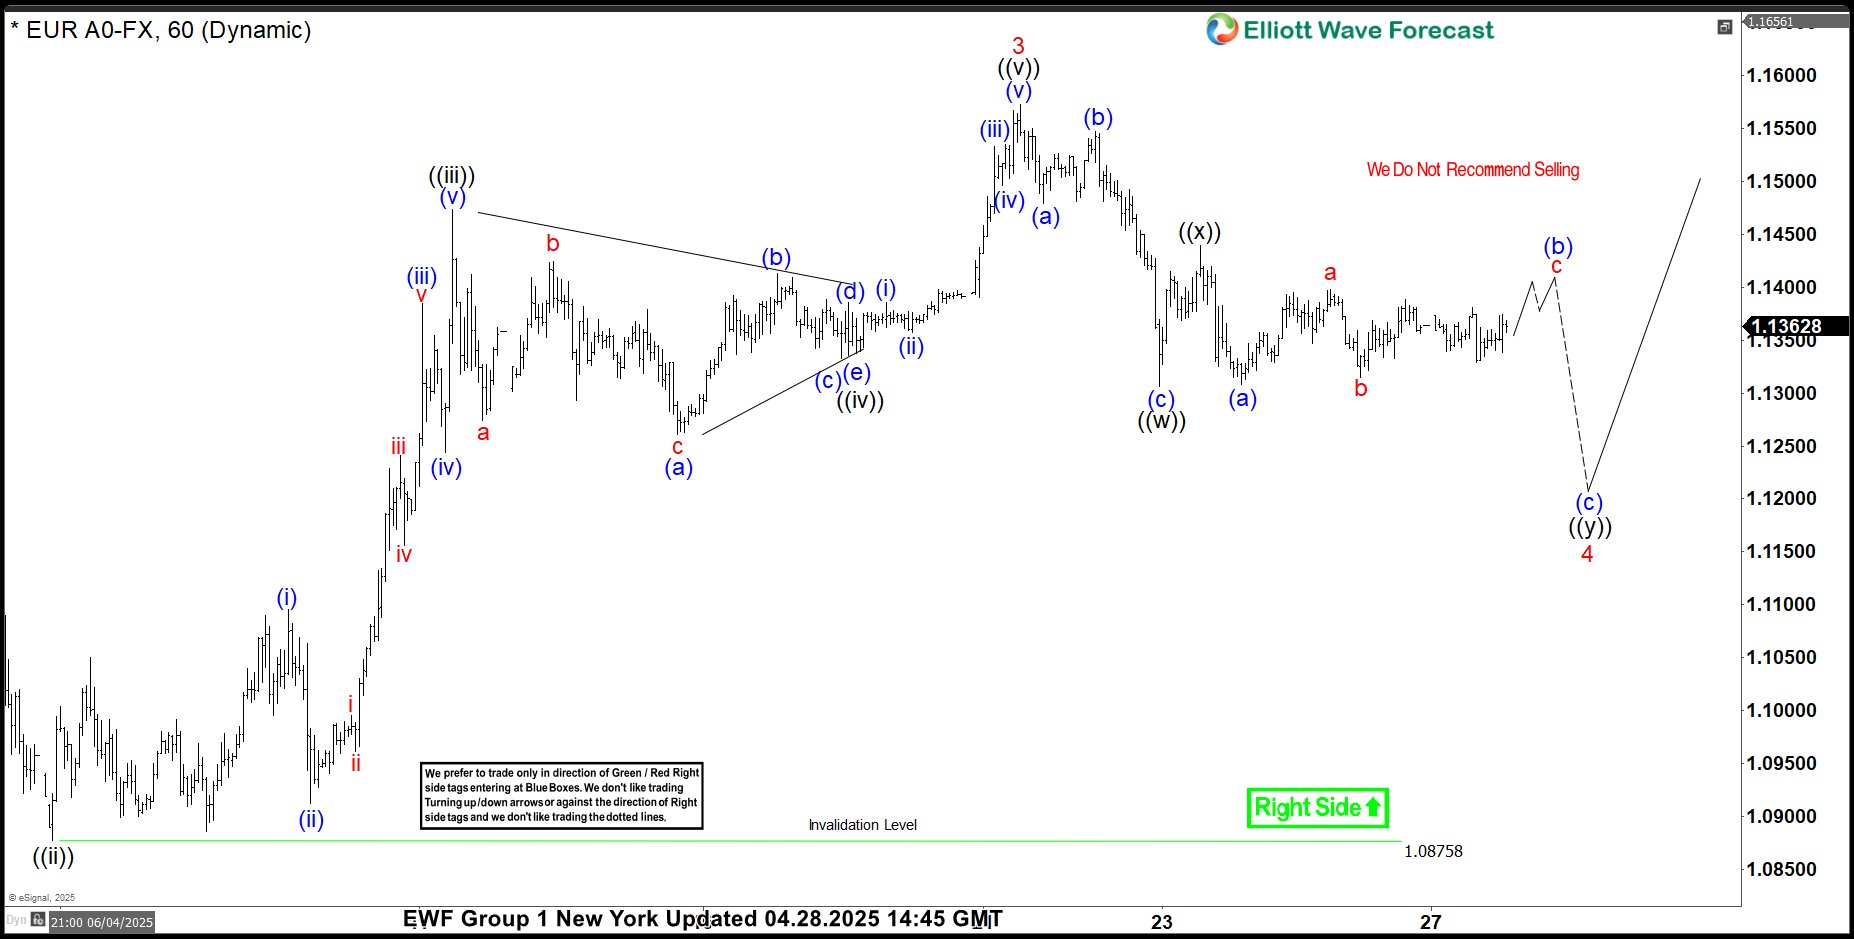
EURUSD Elliott Wave 1 Hour Chart 04.28.2025
The current view suggests that EUR/USD is correcting the cycle from the March 26th low. We count the ((x)) connector as completed at the 1.1444 high. While the price remains below that level, we expect to see another leg down to complete the wave 4 (red) correction.
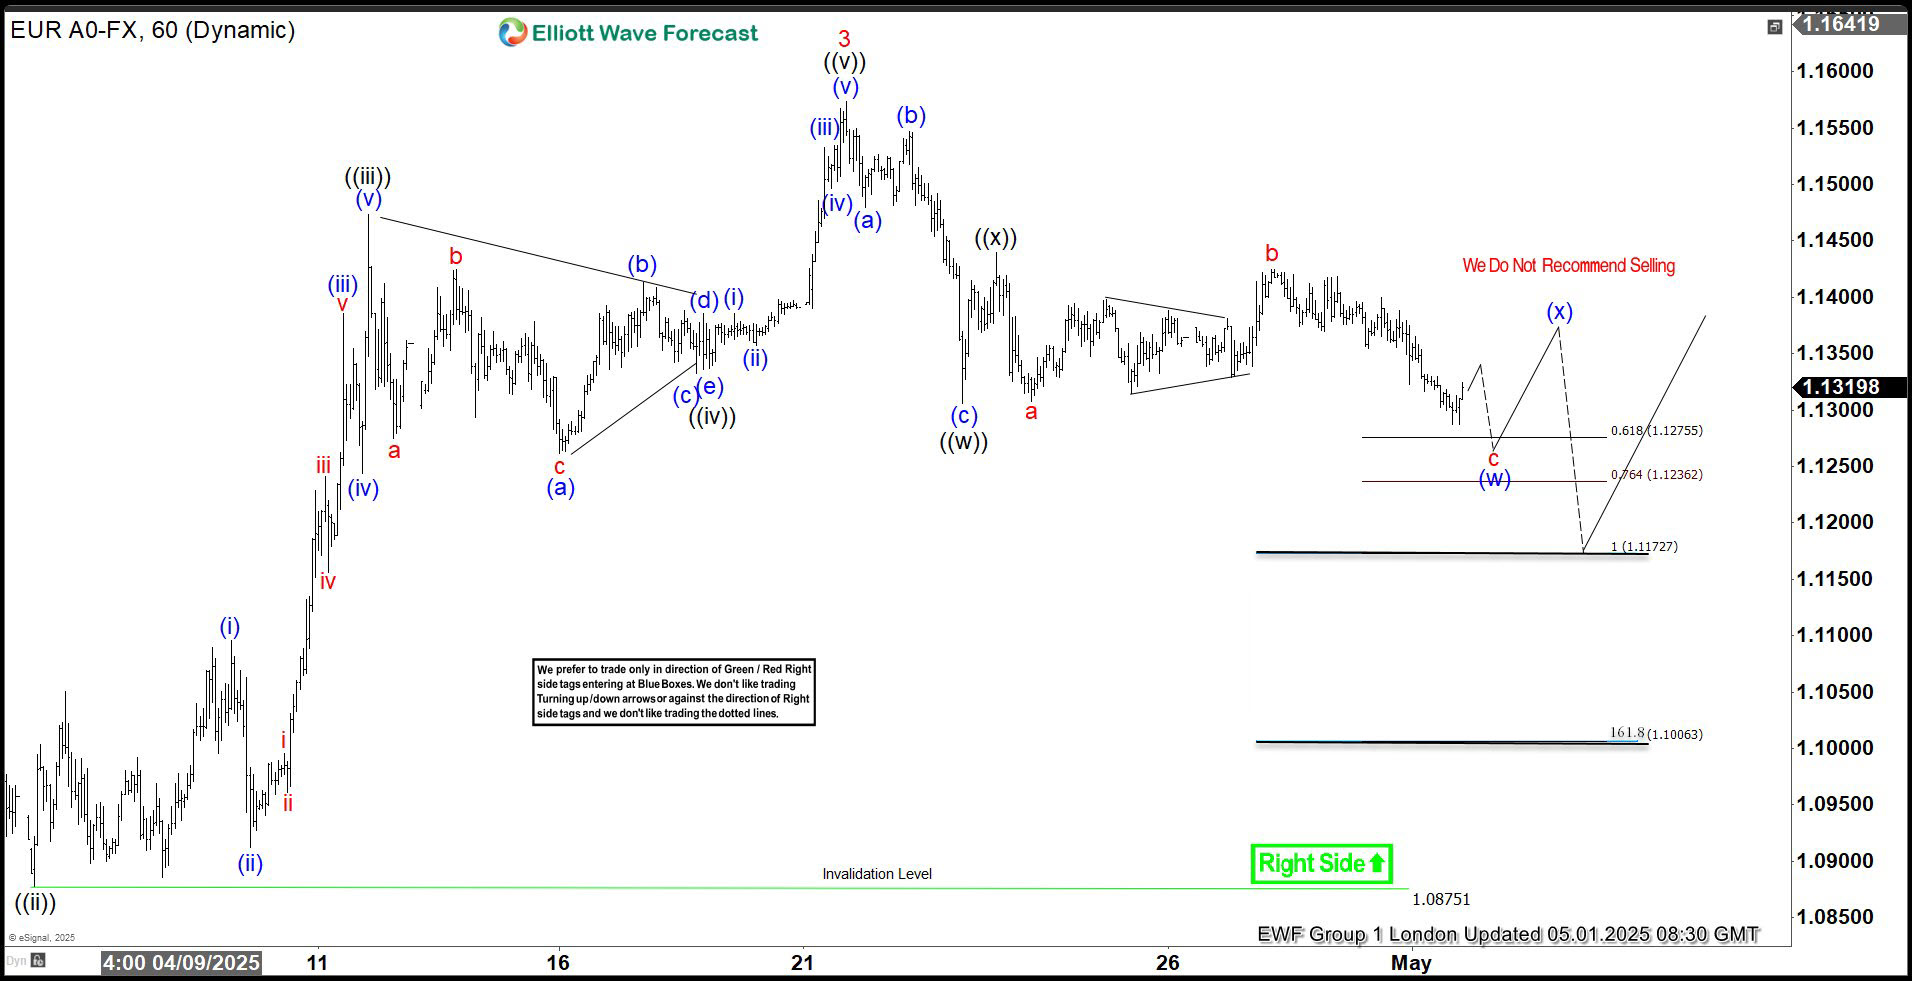
EURUSD Elliott Wave 1 Hour Chart 05.01.2025
The price held the 1.1444 peak and then declined. Eventually, it broke the previous low ((w)) black, confirming that the next leg down is in progress. The next technical zone comes in the 1.12755–1.1236 area, which might give us a three-wave bounce before the pair reaches the main target at the 1.11727 area (buyers zone).