, 5700.00 (which stopped wave 1 at the start of May) and the 61.8% Fibonacci correction of the downward impulse from February.)
S&P 500 index: ⬆️ Buy
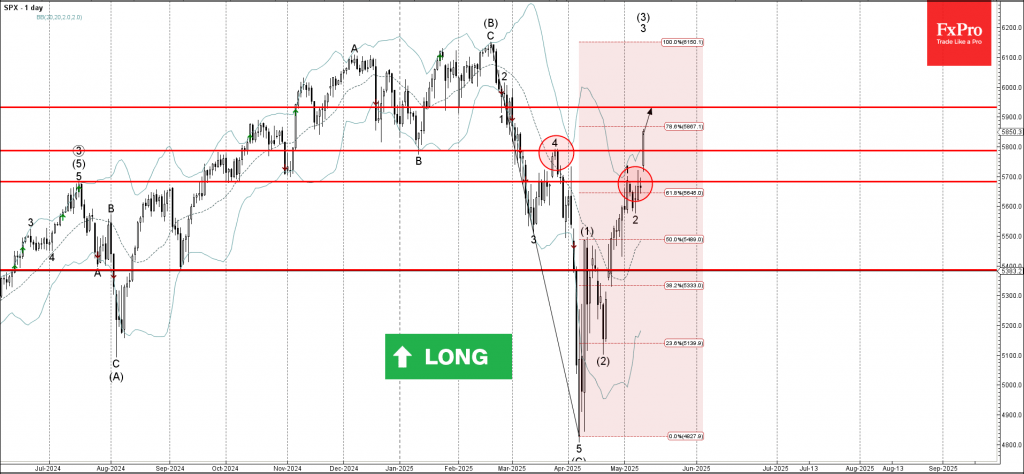
- S&P 500 index broke resistance area
- Likely to rise to resistance level 5930.00
S&P 500 index recently broke the resistance area between the resistance levels 5800.00 (top of wave 4 from March), 5700.00 (which stopped wave 1 at the start of May) and the 61.8% Fibonacci correction of the downward impulse from February.
The breakout of this resistance area is aligned with the short-term impulse wave 3 of the intermediate impulse wave (3) from April.
S&P 500 index can be expected to rise to the next resistance level 5930.00, former support from January and February.