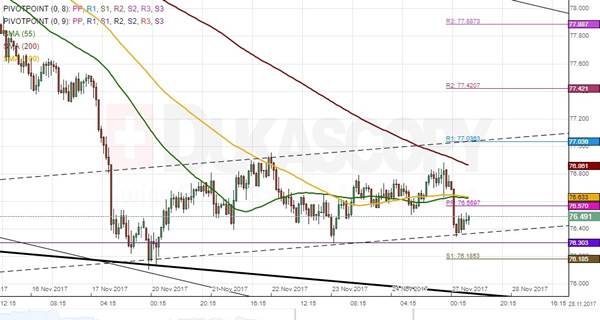
The NZD/JPY currency pair has been guided by three channels. The most senior one was formed mid-June. The Kiwi tested a 2016/2017 high at 84.00 a month later and then edged lower. Meanwhile, the pair bounced off the bottom boundary of the senior channel and the monthly S1 at 76.3025 last week. It started to move in a slight movement up, but has nevertheless failed to accelerate. Currently, the pressure of the monthly S1 and the 200-hour SMAs from both sides are squeezing the Kiwi in a continually narrowing trading range. In case the latter is breached, a subsequent surge is expected to occur towards the monthly PP at 78.86. Conversely, a breakout of the strong support cluster formed by the monthly and weekly S1s at 76.2960 are likely to guide the Kiwi down to the monthly S2 at 74.80.