
A note on lower timeframe confirming price action…
Waiting for lower timeframe confirmation is our main tool to confirm strength within higher timeframe zones, and has really been the key to our trading success. It takes a little time to understand the subtle nuances, however, as each trade is never the same, but once you master the rhythm so to speak, you will be saved from countless unnecessary losing trades. The following is a list of what we look for:
- A break/retest of supply or demand dependent on which way you’re trading.
- A trendline break/retest.
- Buying/selling tails – essentially we look for a cluster of very obvious spikes off of lower timeframe support and resistance levels within the higher timeframe zone.
- Candlestick patterns. We tend to only stick with pin bars and engulfing bars as these have proven to be the most effective.
EUR/USD
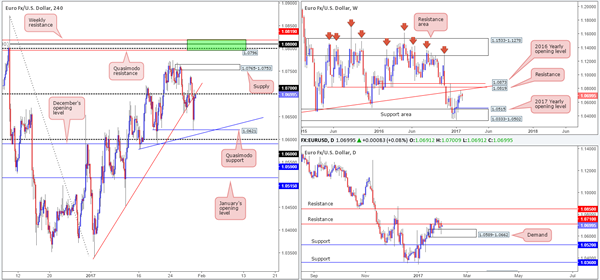
During the course of Monday’s sessions, the single currency clocked highs of 1.0740 a few hours after the open and then rapidly turned course, falling sharply against its US counterpart throughout the London morning segment. Breaking below the 1.07 handle and a neighboring H4 trendline support extended from the low 1.0340, the pair attacked a H4 Quasimodo support at 1.0621 and once again, this time going into the US open, hit the brakes and changed course, driving prices back up to the 1.07 region by the closing bell.
Daily demand at 1.0589-1.0662 remains firm, but, as you can see, has so far be unable to lift the unit above the nearby daily resistance at 1.0710. This could have something to do with the fact that weekly action recently rebounded from a long-term weekly trendline resistance stretched from the low 0.8231.
Our suggestions: From our point of view, the EUR could potentially selloff from its current location. The 1.07 level, coupled with a H4 trendline resistance (1.0340) which is supported by weekly structure is sufficient enough to validate a sell, in our humble opinion. However, trading from this level does not come without risk given that the daily candles are presently bolstered by daily demand at 1.0589-1.0662. This does not mean we will not be looking to short here, all it means is that we’re going to wait for additional confirmation in the form a H4 bear candle before we’re confident enough to pull the trigger.
Data points to consider: ECB President Draghi speaks today at 8am. US CB Consumer confidence report at 3pm GMT.
Levels to watch/live orders:
- Buys: Flat (stop loss: N/A).
- Sells: 1.07 region ([wait for a H4 bear candle to form before looking to execute a trade] stop loss: ideally beyond the trigger candle).
GBP/USD
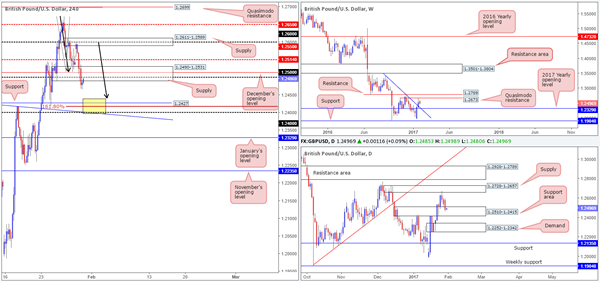
The bearish pulse continues to beat in the GBP/USD market this morning. Sterling came under pressure shortly after Sunday’s open, falling sharply from a H4 supply zone at 1.2611-1.2589. Several H4 tech supports were engulfed during this downward move, including the H4 demand at 1.2490-1.2531 which is currently being retested as supply. On the condition that this base holds firm, the next H4 support target on the horizon comes in at 1.2427: an interesting H4 level. It’s interesting because not only does it fuse beautifully with a H4 AB=CD 161.8% Fib ext., the 1.24 handle and a H4 trendline support taken from the high 1.2432, but it also has additional backing from a daily support area chiseled in at 1.2510-1.2415.
The only grumble we have here is that weekly price is currently selling off from a weekly Quasimodo resistance level at 1.2673, and shows that the next support on tap is 1.2329: the 2017 yearly opening level which converges with the daily demand seen BELOW the current daily support area! Therefore, a bounce is all that should be expected from the above noted H4 supports.
Our suggestions: Supposing that price strikes the 1.24/1.2440 region today (the yellow box), our desk has noted that a buy would only be considered valid if, and only if, a reasonably sized H4 bull candle takes shape from here. The first take-profit target will likely be the 1.25 neighborhood, which is also where we’d strongly advise traders to reduce risk to breakeven.
Data points to consider: US CB Consumer confidence report at 3pm GMT.
Levels to watch/live orders:
- Buys: 1.24/1.2440 region ([wait for a H4 bull candle to form before looking to execute a trade] stop loss: ideally beyond the trigger candle).
- Sells: Flat (stop loss: N/A).
AUD/USD
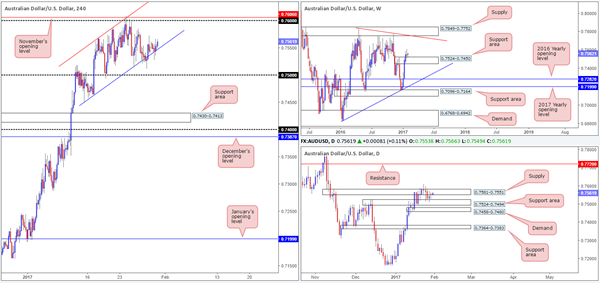
In recent sessions, we can see that the commodity-linked currency continued to cling to the H4 channel support drawn from the low 0.7449, bidding price to a high of 0.7567 on the day. While H4 structure indicates room to move higher today, at least until the 0.76 boundary/November’s opening base at 0.7606, it may be worth noting that the daily candles remain lurking within the walls of a daily supply area coming in at 0.7581-0.7551. On the flip side to this, nonetheless, weekly price happens to agree with the H4 chart, as the candles are currently seen buoyed by the top edge of a weekly support area penciled in at 0.7524-0.7450.
Our suggestions: Based on the above points, an intraday long from the current H4 channel support could be an option, targeting 0.76/0.7606. Lower-timeframe confirmation would be required before we’d consider this trade valid (see the top of this report for more info on confirmation), but unfortunately is absent for now. Therefore, our team will not be considering longs from this region at this time.
In addition to the above, attempting to hold longs beyond 0.7606/0.76 would be a little too risky for our liking, hence only considering the above long an intraday setup, unless of course we happen to see the daily candles CLOSE above daily supply at 0.7581-0.7551.
Data points to consider: US CB Consumer confidence report at 3pm GMT.
Levels to watch/live orders:
- Buys: A long from the current H4 channel support is only considered valid on the basis that a lower-timeframe confirming buy signal is seen (stop loss: dependent on where one confirms this line).
- Sells: Flat (stop loss: N/A).
USD/JPY
US President Trump’s decision to halt some immigration revived demand for the safe-haven yen yesterday. Following an upward rejection of December’s opening level at 114.68 going into the London session, the USD/JPY collapsed, wiping out the 114 psychological handle and clocking lows of 113.44 on the day.
As we write, the weekly candles are seen hovering mid-range between weekly resistance at 116.08 and a weekly support area formed at 111.44-110.10. Meanwhile, down on the daily timeframe, price recently sold off from daily supply at 115.62-114.60 and looks to be on course to test daily demand at 111.35-112.37, shadowed closely by a daily broken Quasimodo line at 110.58.
Our suggestions: Right now, we do not see much room for maneuver. Yes, the 114 handle could be retested as resistance today, but this base lacks any noteworthy confluence, in our opinion. Similarly, the H4 support at 113.25 also has little to offer regarding converging structure.
The only area that really jumps out to us this morning is the H4 demand at 112.05-112.37. With the understanding that this H4 demand base has the backing of not only the current daily demand, but also the weekly support area as well, there’s a fair chance that price will respond from here. While this may be true, traders still need to be prepared for the possibility of a fakeout through this zone, as price may want to drive deeper into the above noted higher-timeframe areas before rallying higher. With that being the case, waiting for at least a H4 bull candle to form may be the better path to take.
Data points to consider: US CB Consumer confidence report at 3pm GMT. Bank of Japan’s monetary policy decision. There is no change expected at this meeting, but traders will be closely focusing on the tone of the central bank, while looking for clues to future policy actions.

Levels to watch/live orders:
- Buys: 112.05-112.37 ([a reasonably sized H4 bull candle will need to be seen from here before a trade can be executed] stop loss: ideally beyond the trigger candle).
- Sells: Flat (stop loss: N/A).
USD/CAD
The value of the USD/CAD weakened amid yesterday’s trading following a spike to highs of 1.3169. H4 candle action, as you can see, whipsawed through the H4 mid-way resistance at 1.3150 and tapped the upper area of a H4 supply zone coming in at 1.3171-1.3155. This – coupled with a H4 AB=CD approach (see black arrows) that terminated around the 1.3161 mark, was, technically speaking, clearly enough to send the market lower.
However, weekly demand at 1.3006-1.3115 is still very much in the picture, albeit struggling somewhat at the moment. In addition to this, we can also see that there’s a nearby daily demand coming in at 1.3006-1.3041 (located around the lower edge of the above noted weekly demand) that happens to fuse with a daily trendline support taken from the low 1.2654.
Our suggestions: With yesterday’s downward move aggressively whipsawing through the 1.31 handle, the level appears to be on the verge of giving way. With this, the next notable area below comes in at 1.3029: a H4 Quasimodo support level which happens to be positioned within the two aforementioned higher-timeframe demands. Although the H4 Quasimodo level boasts attractive confluence, we must take into account that price is also nearing the 1.30 mark – a level which is likely watched by the majority of the market. Does this mean we should ignore longs from the H4 Quasimodo formation? No! What it does mean though is that in order to buy from this H4 base, one might (to be on the safe side) want to consider setting stops beyond the 1.30 level as this will likely give the trade room to breathe, since this number is also located just beneath the above noted higher-timeframe demands.
Since we can find no logical area for stop-loss placement beyond 1.30 we’ll wait for H4 candle confirmation, before deciding whether or not to buy from here.
Data points to consider: US CB Consumer confidence report at 3pm. Canadian GDP data set for release at 1.30pm along with the BoC Gov. Poloz speaking at around 10.30pm GMT.

Levels to watch/live orders:
- Buys: 1.3029 region ([a reasonably sized H4 bull candle will need to be seen from here before a trade can be executed] stop loss: ideally beyond the trigger candle).
- Sells: Flat (stop loss: N/A).
USD/CHF
For those who read our previous report on the Swissy pair you may recall that our team highlighted the H4 mid-range Quasimodo support level at 0.9948 as a place to consider entering long from. As we can see, the level has so far held firm and is likely to promote further buying in this market today at least up until the underside of the H4 range at 0.9972, followed by parity (1.0000).
Our reasoning behind our confidence in this level, as we mentioned in yesterday’s report, simply comes down to the fact that it’s positioned nearby the weekly support coming in at 0.9943. Well done to any of our readers who managed to lock in a position from here.
Our suggestions: Other than the H4 level 0.9948, there’s not much else to hang our hat on at the moment. With that being the case, unless price retests the above noted H4 level for a second time today (entering long may be possible with the backing of a lower-timeframe buy signal – see the top of this report), we’ll remain on the sidelines.
Data points to consider: US CB Consumer confidence report at 3pm GMT.

Levels to watch/live orders:
- Buys: 0.9948 region ([wait for a lower-timeframe confirming setup to form before looking to execute a trade] stop loss: dependent on where one confirms this area).
- Sells: Flat (stop loss: N/A).
DOW 30
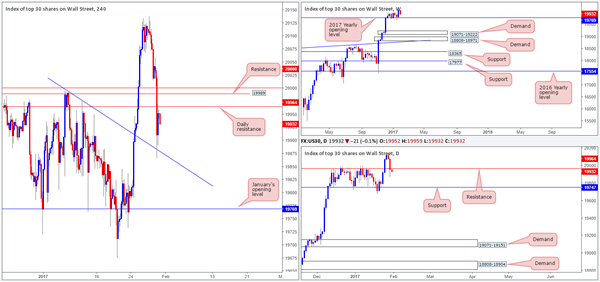
On the back of lower oil prices and US President Trump’s decision to halt some immigration, US equities fell sharply yesterday. Price blitzed its way through the 20000 mark, as well as the H4 support at 19989 (now acting resistance) and also daily support at 19964, which, as you can see, is currently being retested as resistance. Apart from the H4 trendline support taken from the high 19995, there’s very little seen standing in the way of price retesting January’s opening level at 19769, which happens to be located a few points above daily support at 19747.
Our suggestions: Unfortunately, we are unable to pin down a lower-timeframe confirming sell setup from the current daily resistance line. Therefore, at least for our desk, we will not be participating in selling from this zone.
Data points to consider: US CB Consumer confidence report at 3pm GMT.
Levels to watch/live orders:
- Buys: Flat (stop loss: N/A).
- Sells: Flat (stop loss: N/A).
GOLD
The US dollar struck the 101.00 level yesterday (see the US dollar index), but was unable to sustain gains beyond this point. This selling pressure bolstered the yellow metal yesterday and lifted price up to a H4 resistance zone coming in at 1198.4-1203.8.
Now, selling from this angle is considered to be a risky play in our book. Not only are the daily candles seen extending higher, following Friday’s buying tail that pierced through the lower edge of a daily support area at 1197.4-1187.7, but weekly action is also looking as though it may retest the underside of a weekly trendline resistance taken from the low 1130.1, which is positioned just above this H4 area!
Our suggestions: With the above notes taken on board, our team has no intention in selling from the current H4 resistance area today. We will, however, be watching the H4 candle action should price strike the above noted weekly trendline resistance, as this could provide a nice base in which to short from. Failing this, the next area of interest is the daily supply area at 1220.9-1212.0 that holds a H4 Quasimodo resistance at 1217.5 and converging H4 trendline resistance extended from the low 1187.7 within its boundaries.
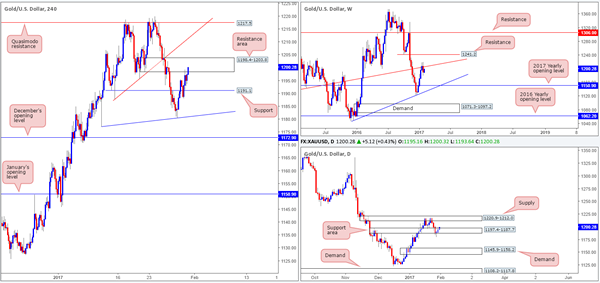
Levels to watch/live orders:
- Buys: Flat (stop loss: N/A).
- Sells: Watch the weekly trendline resistance. Should a H4 bear candle form off this line, this is a valid short signal, with stops placed above the trigger candle. 1217.5 region ([this could be an area, dependent on the time of day, one may consider trading without the need for additional confirmation] stop loss: beyond the daily supply at 1220.9-1212.0).


