
Key Highlights
Bitcoin started a fresh increase above the $106,500 resistance.
- BTC/USD cleared a major bearish trend line with resistance at $107,000 on the 4-hour chart.
- Ethereum recovered losses and climbed above the $2,500 resistance.
- XRP price is consolidating and facing hurdles near $2.320.
Bitcoin Price Technical Analysis
Bitcoin price started a fresh increase above the $103,500 zone against the US Dollar. BTC was able to surpass the $105,000 and $106,500 resistance levels.
Looking at the 4-hour chart, the price cleared a major bearish trend line with resistance at $107,000. The price settled above the 100 simple moving average (red, 4-hour) and the 200 simple moving average (green, 4-hour).
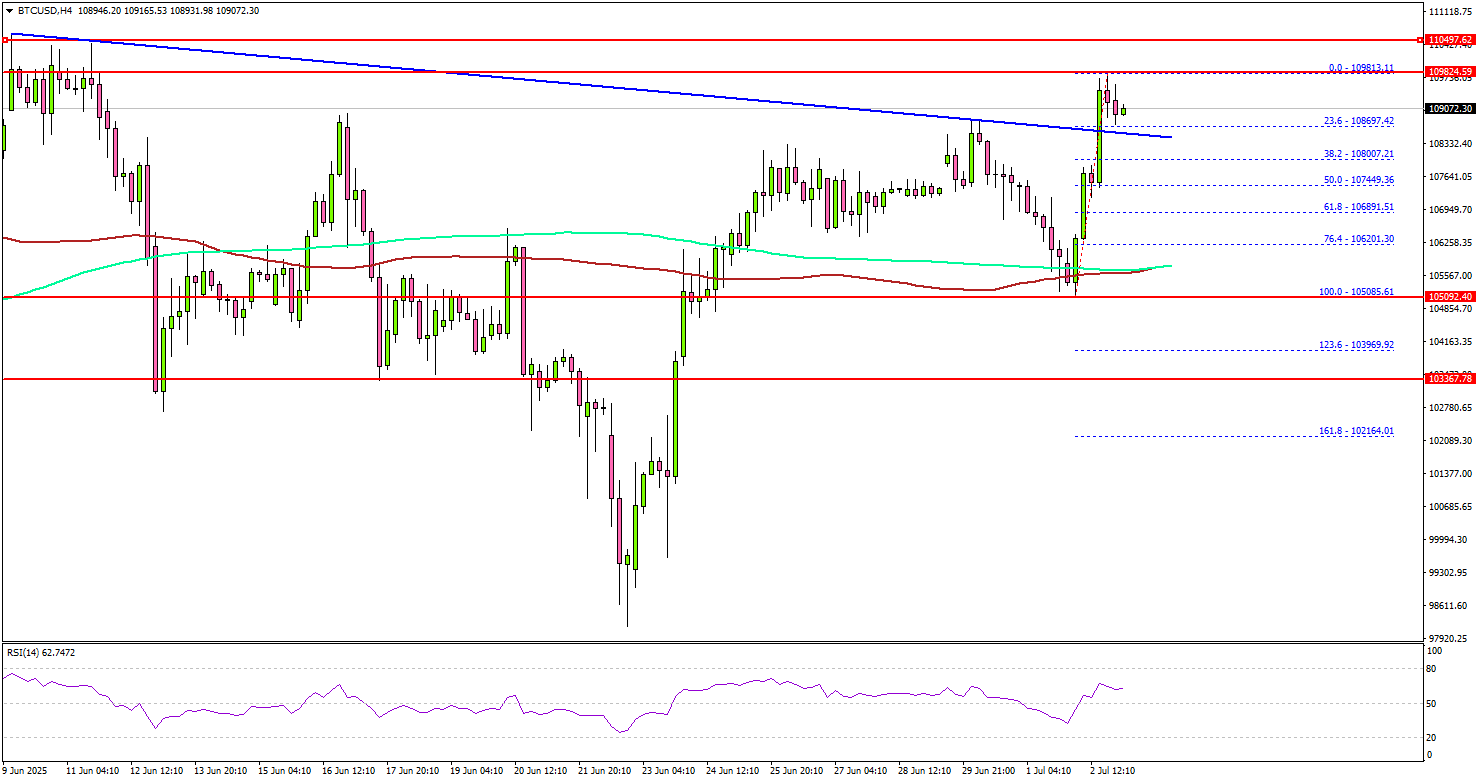
A high was formed at $109,813 and the price is now consolidating gains. It is finding bids near the same trend line and the 23.6% Fib retracement level of the upward move from the $105,085 swing low to the $109,811 high.
On the upside, the price could face resistance near the $109,800 level. The next key resistance is $110,000. A successful close above $110,000 might start another steady increase.
In the stated case, the price may perhaps rise toward the $112,000 level. Any more gains might call for a test of $115,000 and a new all-time high. If there is a pullback, Bitcoin might find support near the $108,200 level.
A downside break below $108,200 might send BTC toward the $107,500 support. Any more losses might send the price toward the $105,500 support zone.
Looking at Ethereum, the bulls seem to be in control, and they were able to push the price above the $2,500 resistance zone.
Today’s Economic Releases
- US Initial Jobless Claims – Forecast 240K, versus 236K previous.
- US nonfarm payrolls for June 2025 – Forecast 110K, versus 139K previous.
- US Unemployment Rate for June 2025 – Forecast 4.3%, versus 4.2% previous.


