
 suggest bullish view against September-2022 low in weekly. In daily, it should remain supported in 3, 7 or 11 swings to continue rally to extend higher. In daily, it ended ((4)) correction in 7 swings sequence at 3120.20 low in 5.15.2025 low against April-2025 peak. Above May-2025 low, it should continue rally targeting 3589 or higher levels, while pullback stays above 3246.55 low. In 4-hour, it placed 1 at 3452.5 low in proposed diagonal sequence. Within 1, it ended ((i)) at 3252.05 high, ((ii)) at 3245.20 low, ((iii)) at 3365.93 high, ((iv)) at 3245.20 low & finally ((v)) ended at 3452.50 high. It ended 2 in 7 swings correction at 3246.55 low in 6.29.2025. Within 2 pullback, it ended ((w)) at 3340.18 low, ((x)) at 3398.35 high & ((y)) at 3246.55 low in extreme area. It provided short term buying opportunity in extreme area, corrected 0.618 Fibonacci retracement of 1.)
Elliott Wave sequence in XAUUSD (GOLD) suggest bullish view against September-2022 low in weekly. In daily, it should remain supported in 3, 7 or 11 swings to continue rally to extend higher. In daily, it ended ((4)) correction in 7 swings sequence at 3120.20 low in 5.15.2025 low against April-2025 peak. Above May-2025 low, it should continue rally targeting 3589 or higher levels, while pullback stays above 3246.55 low. In 4-hour, it placed 1 at 3452.5 low in proposed diagonal sequence. Within 1, it ended ((i)) at 3252.05 high, ((ii)) at 3245.20 low, ((iii)) at 3365.93 high, ((iv)) at 3245.20 low & finally ((v)) ended at 3452.50 high. It ended 2 in 7 swings correction at 3246.55 low in 6.29.2025. Within 2 pullback, it ended ((w)) at 3340.18 low, ((x)) at 3398.35 high & ((y)) at 3246.55 low in extreme area. It provided short term buying opportunity in extreme area, corrected 0.618 Fibonacci retracement of 1.
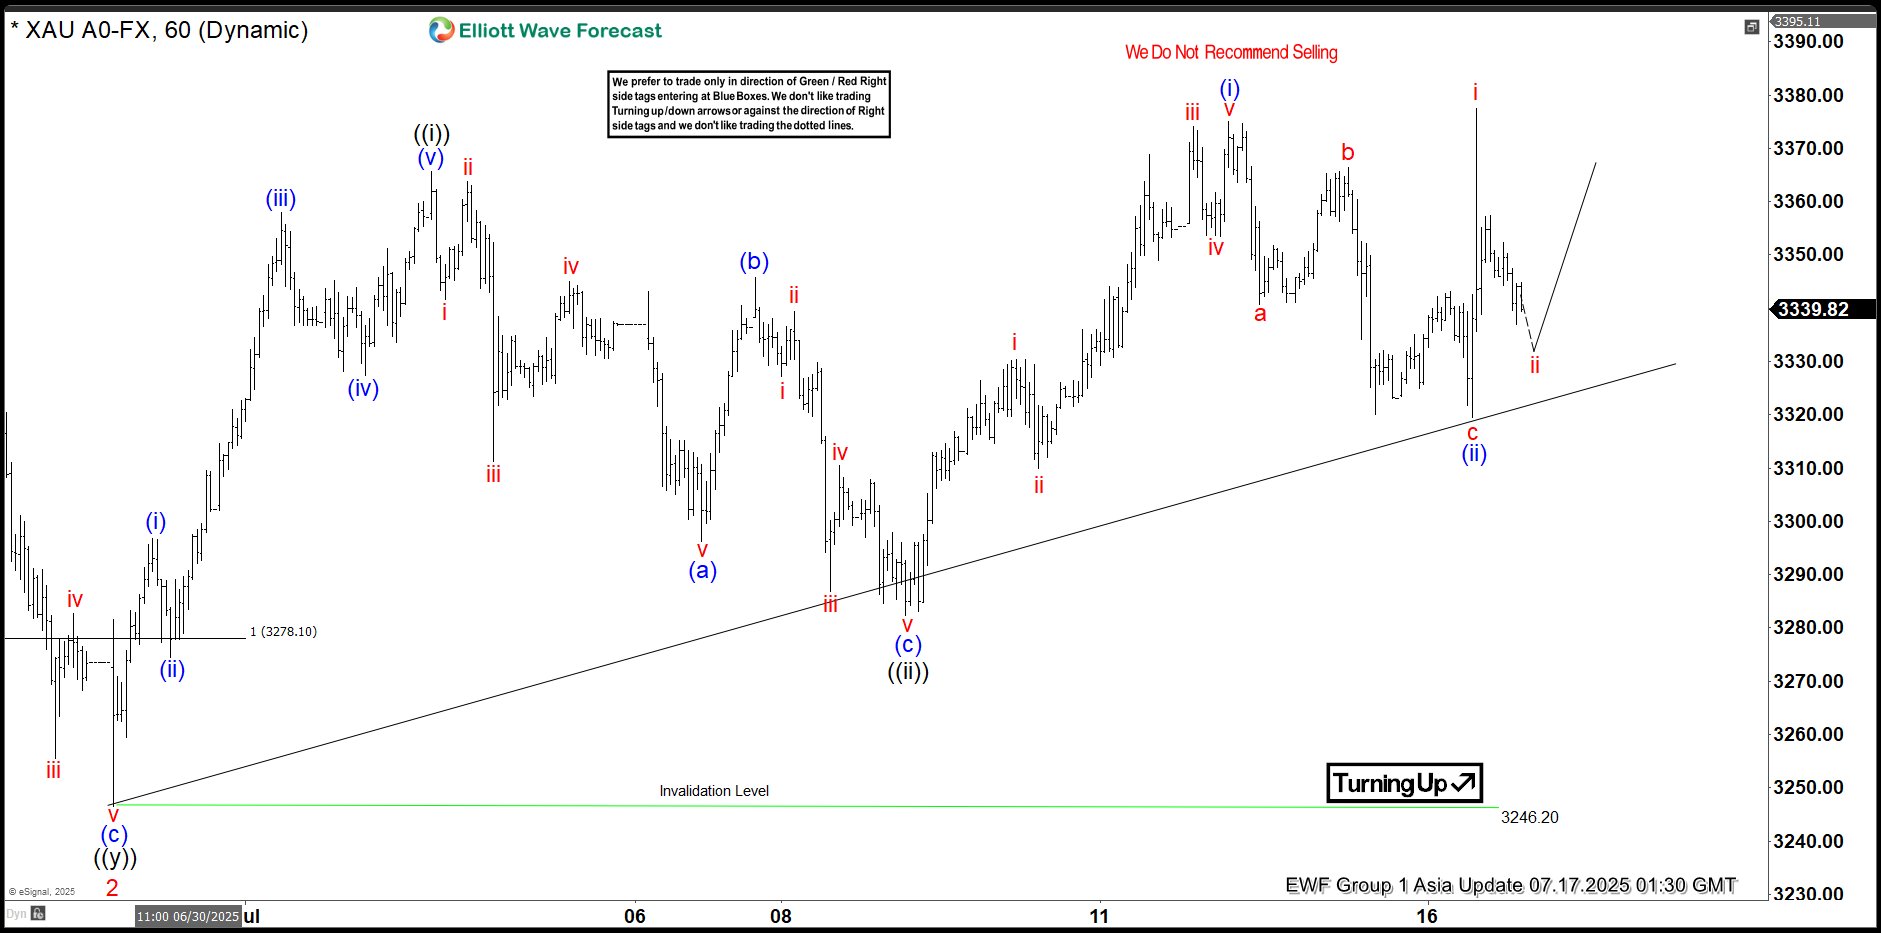
Above 2 low, It is showing nest in 1-hour sequence expecting further rally. It needs to break above 6.15.2025 high of 3452.5 to confirm the upside to extend daily sequence. Short term, it placed ((i)) of 3 at 3365.70 high, ((ii)) at 3282.43 low, (i) of ((iii)) at 3374.96 high & (ii) of ((iii)) at 3319.50 low. It is showing higher high since 2 low in 5 swings, which can be nest or a diagonal sequence, if breaks below 7.09.2025 low before rally higher above 6.29.2025 low. In (i), it ended i at 3330.32 high, ii at 3309.91 low, iii at 3374.02 high, iv at 3353.43 low & v at 3374.96 high. In (ii) pullback, it placed a at 3340.76 low, b at 3366.38 high & c as diagonal at 3319.50 low. It already broke above (i) high, confirmed upside can be possible as long as it stays above 3319.50 low.
Currently, it favors pullback in ii of (iii), while placed i at 3377.48 high. It expect pullback in 3 swings to hold above 3319.50 low before rally continue in iii of (iii). The further upside confirms when it break above 3452.50 high. Five swings rally from 6.29.2025 low, suggests more upside should be unfold. The next leg higher expect to erase the momentum divergence in 1-hour to be (iii) of ((iii)). Alternatively, if it breaks below 7.09.2025 low, it can be pullback against 6.29.2025 low, while ended ((i)) in diagonal at 3377.48 high. Gold is choppy after April-2025 peak. It can even do double correction, if breaks below 6.29.2025 low, correcting against May-2025 low before rally continue. We like to buy the pullback in 3, 7, or 11 swings pullback as it is bullish in weekly sequence.
XAUUSD (GOLD) – 60-Minute Elliott Wave Technical Chart:
XAUUSD (GOLD) Elliott Wave Technical Video:
You are currently viewing a placeholder content from Default. To access the actual content, click the button below. Please note that doing so will share data with third-party providers.