
GBP/USD started a downside correction from the 1.3620 zone. USD/CAD declined and now consolidates below the 1.3750 level.
Important Takeaways for GBP/USD and USD/CAD Analysis Today
- The British Pound started a fresh decline and settled below the 1.3500 zone.
- There is a connecting bullish trend line forming with support at 1.3415 on the hourly chart of GBP/USD at FXOpen.
- USD/CAD started a fresh decline after it failed to clear the 1.3775 resistance.
- There is a key bullish trend line forming with support at 1.3715 on the hourly chart at FXOpen.
GBP/USD Technical Analysis
On the hourly chart of GBP/USD at FXOpen, the pair struggled above the 1.3600 zone. The British Pound started a fresh decline below the 1.3550 pivot level against the US Dollar, as discussed in the previous analysis.
The pair dipped below the 1.3500 and 1.3450 levels. A low was formed at 1.3364 and the pair is now consolidating losses. On the upside, it is facing resistance near the 1.3475 level. The next key resistance is near 1.3490 and the 50% Fib retracement level of the downward move from the 1.3619 swing high to the 1.3364 low.
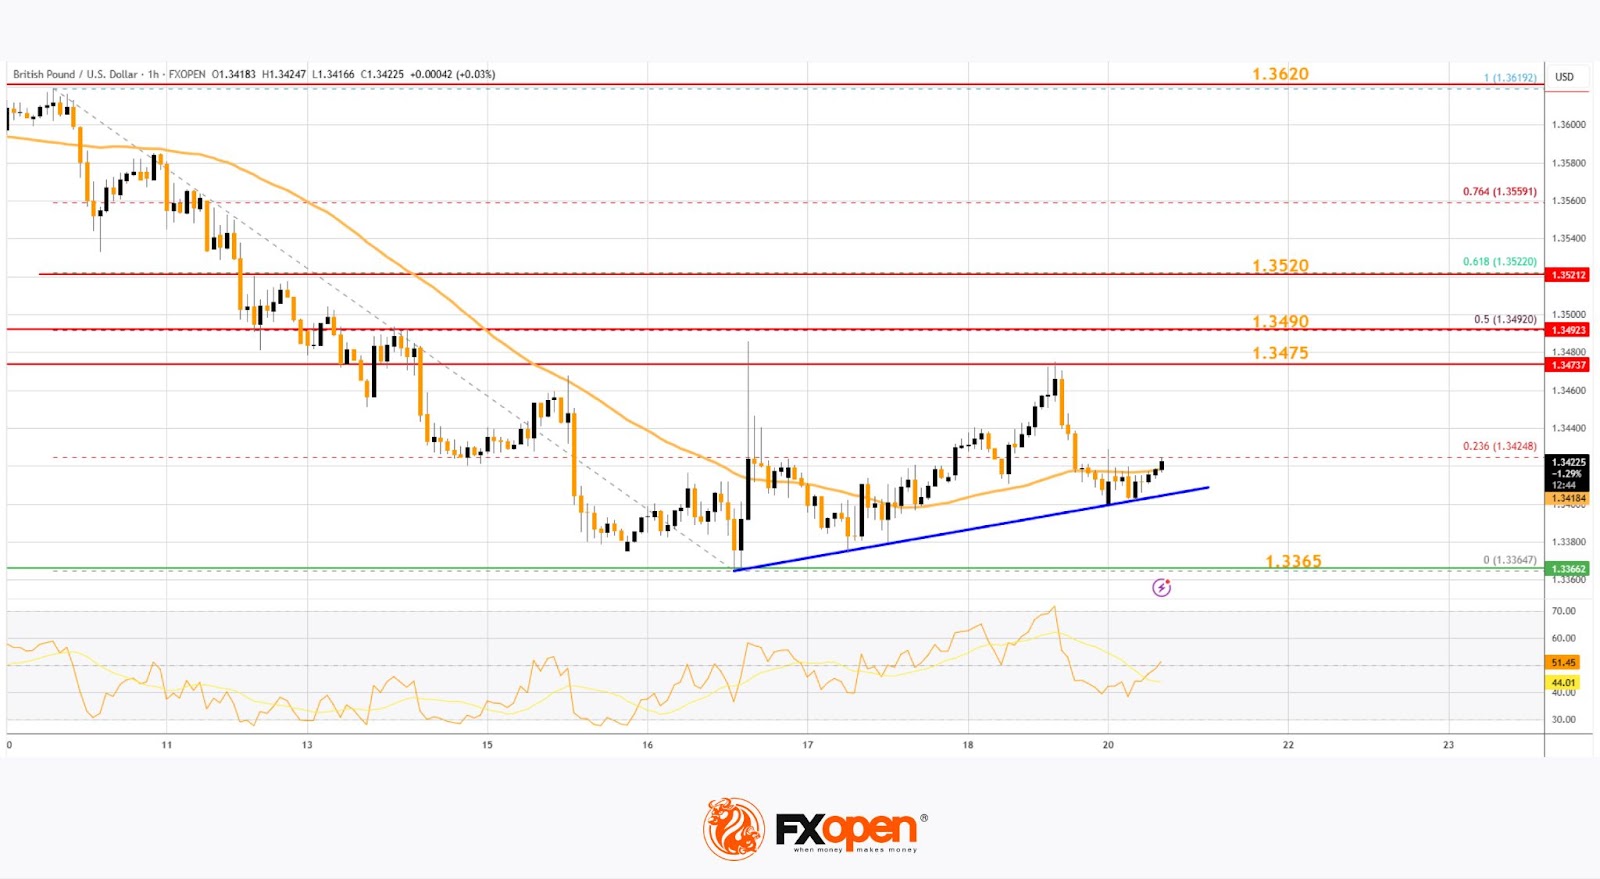
An upside break above the 1.3490 zone could send the pair toward 1.3520 and the 61.8% Fib retracement level.
More gains might open the doors for a test of 1.3620. If there is another decline, the pair could find support near the 1.3415 level and a connecting bullish trend line. The first major support sits near the 1.3365 zone.
The next major support is 1.3350. If there is a break below 1.3350, the pair could extend the decline. The next key support is near the 1.3320 level. Any more losses might call for a test of 1.3250.
USD/CAD Technical Analysis
On the hourly chart of USD/CAD at FXOpen, the pair climbed toward the 1.3775 resistance zone before the bears appeared. The US Dollar formed a swing high near 1.3774 and recently declined below the 1.3750 support against the Canadian Dollar.
There was also a close below the 50-hour simple moving average and 1.3735. The pair is now consolidating losses below the 50% Fib retracement level of the downward move from the 1.3774 swing high to the 1.3695 low. But the bulls are active near the 1.3700 level.
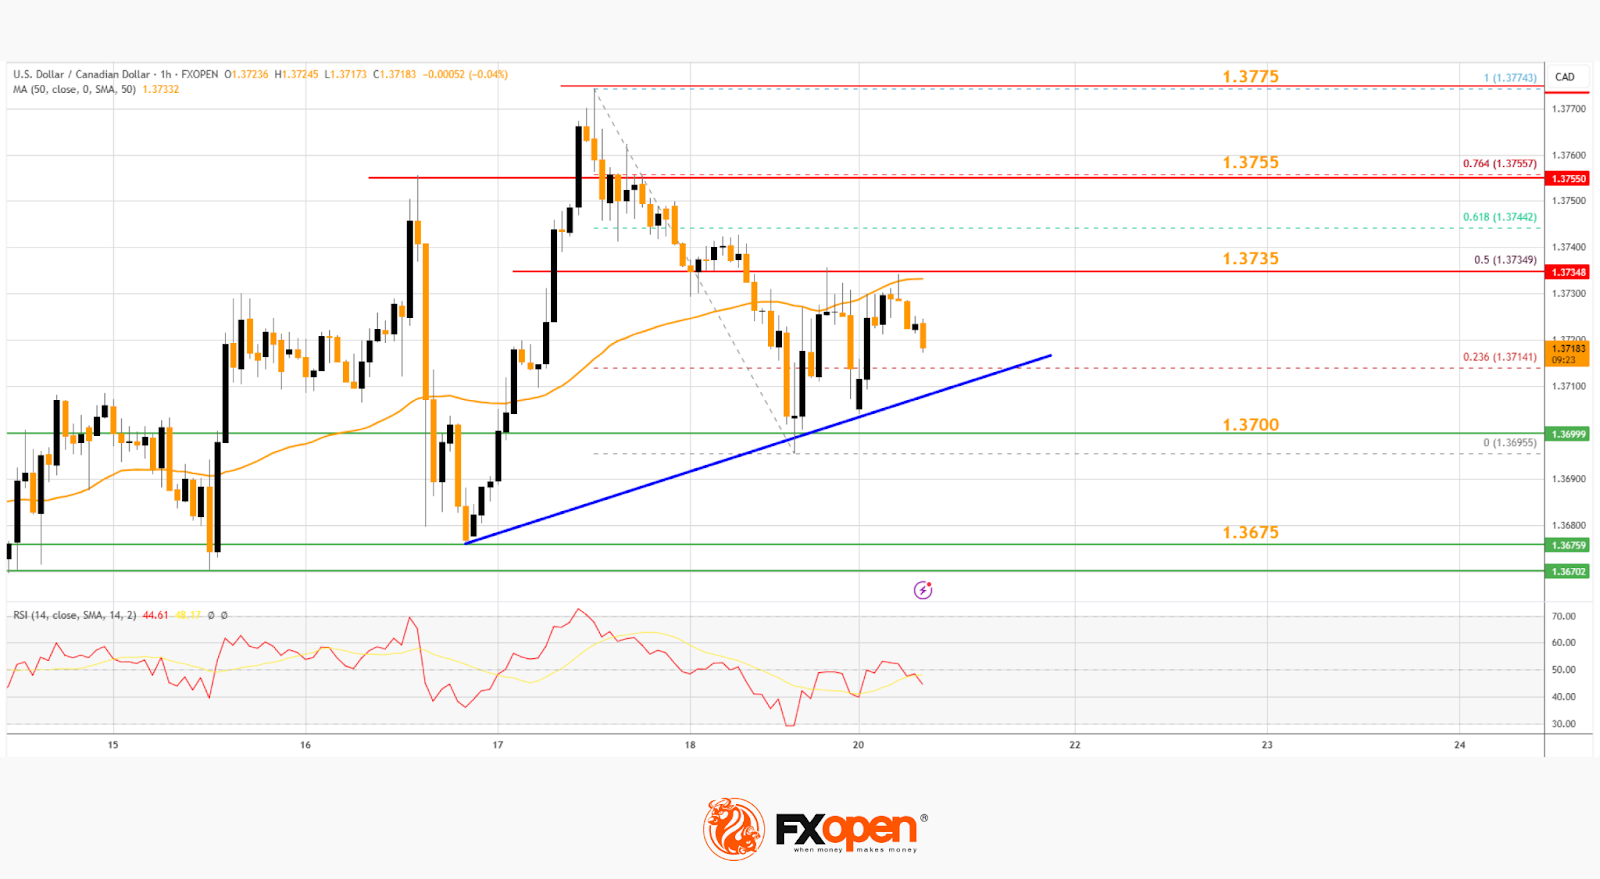
If there is a fresh increase, the pair could face resistance near the 1.3735 level. The next key resistance on the USD/CAD chart is near the 1.3755 level or the 61.8% Fib retracement level.
If there is an upside break above 1.3755, the pair could rise toward 1.3775. The next major resistance is near the 1.3800 zone, above which it could rise steadily toward 1.3880.
Immediate support is near the 1.3715 level and a key bullish trend line. The first major support is near 1.3675. A close below the 1.3675 level might trigger a strong decline. In the stated case, USD/CAD might test 1.3650. Any more losses may possibly open the doors for a drop toward the 1.3620 support.
This article represents the opinion of the Companies operating under the FXOpen brand only. It is not to be construed as an offer, solicitation, or recommendation with respect to products and services provided by the Companies operating under the FXOpen brand, nor is it to be considered financial advice.
Trade over 50 forex markets 24 hours a day with FXOpen. Take advantage of low commissions, deep liquidity, and spreads from 0.0 pips. Open your FXOpen account now or learn more about trading forex with FXOpen.
This article represents the opinion of the Companies operating under the FXOpen brand only. It is not to be construed as an offer, solicitation, or recommendation with respect to products and services provided by the Companies operating under the FXOpen brand, nor is it to be considered financial advice.