
The Swiss Franc has been on a formidable run in 2025, continuing a trend that began when it reached parity with the US Dollar in November 2022.
With the American Exceptionalism theme, widening deficits, and growing trade distrust, markets have sought the CHF as a stable hedge against the Greenback.
Switzerland’s neutrality in economic and geopolitical affairs—and its low, stable inflation—make it an attractive safe haven, especially in a world facing fresh conflicts.
The Franc’s rally to 2011 highs has also been fueled by regional currency trends. Since early 2025, the Euro’s strength has lifted its neighbors, adding tailwinds to the CHF.
This trend is actually one to watch in Forex where currencies tend to move in tandem with their neighbours – It’s an historic trend but got exacerbated with the ongoing geopolitics.
Still, the Swissie hit a local top in July against most majors, including the Yen against which it attained weekly record highs.
While the CHF’s appreciation has not been as explosive as the Euro’s, the trend had remained consistent and persistent – but is it now over?
Next, we’ll look at USDCHF technicals to see if momentum can hold—or if a reversal is on the horizon.
Which safe-haven currency to choose – A small parenthesis on CHF/JPY
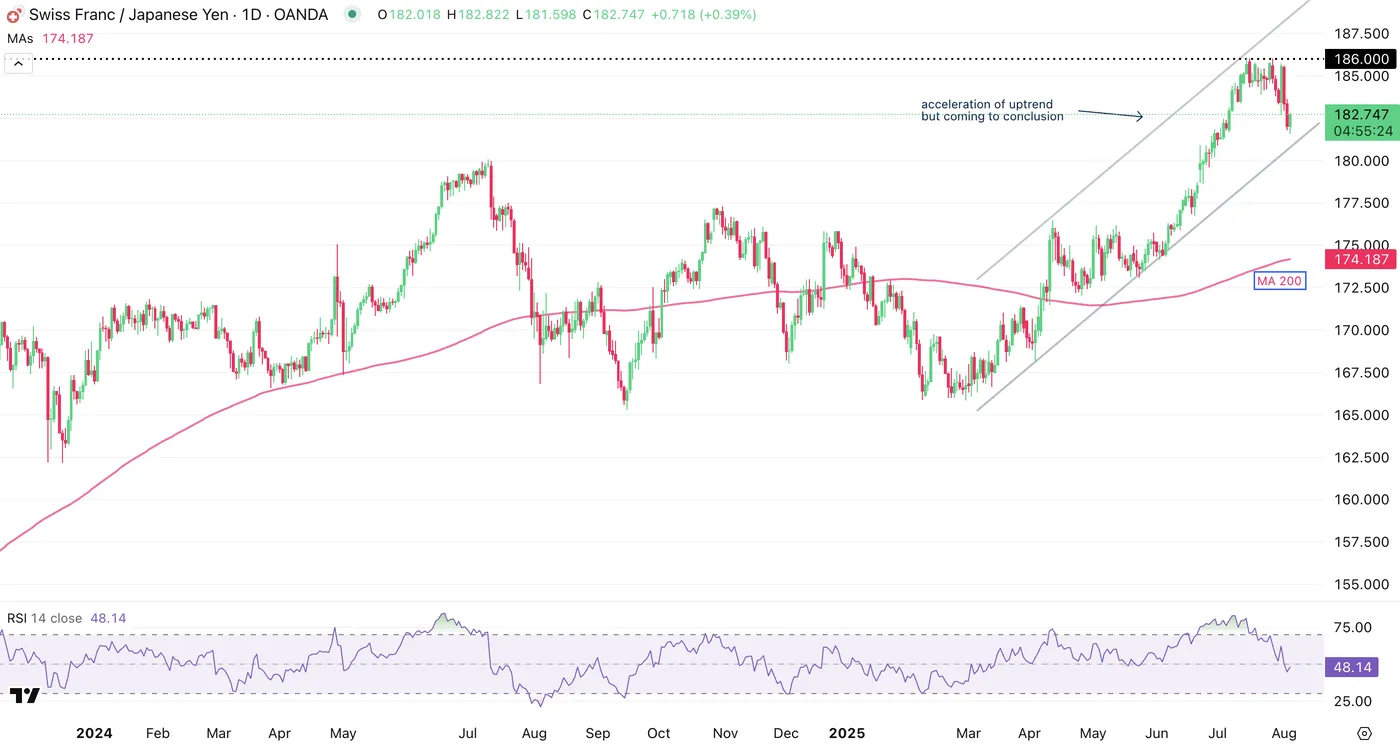
CHF/JPY Daily Chart, August 5, 2025 – Source: TradingView
CHF/JPY has been up-trending since May 2020 (which coincides with lows on Global Yields post-COVID peak fears), and this same trend found some steep acceleration, particularly since Liberation Day.
The pair went from 109.00 lows to the current 186.00 highs.
One aspect to consider when looking at this pair is the Safe-Haven nature of both currencies—the current overperformance of the Franc has marked it as the preferred option for flight-to-safety exposure.
We are now seeing this trend conclude.
The rest is to see if the recent highs mark an intermediate top or more one for the longer-run.
USD/CHF Technical Analysis
USD/CHF Daily Chart
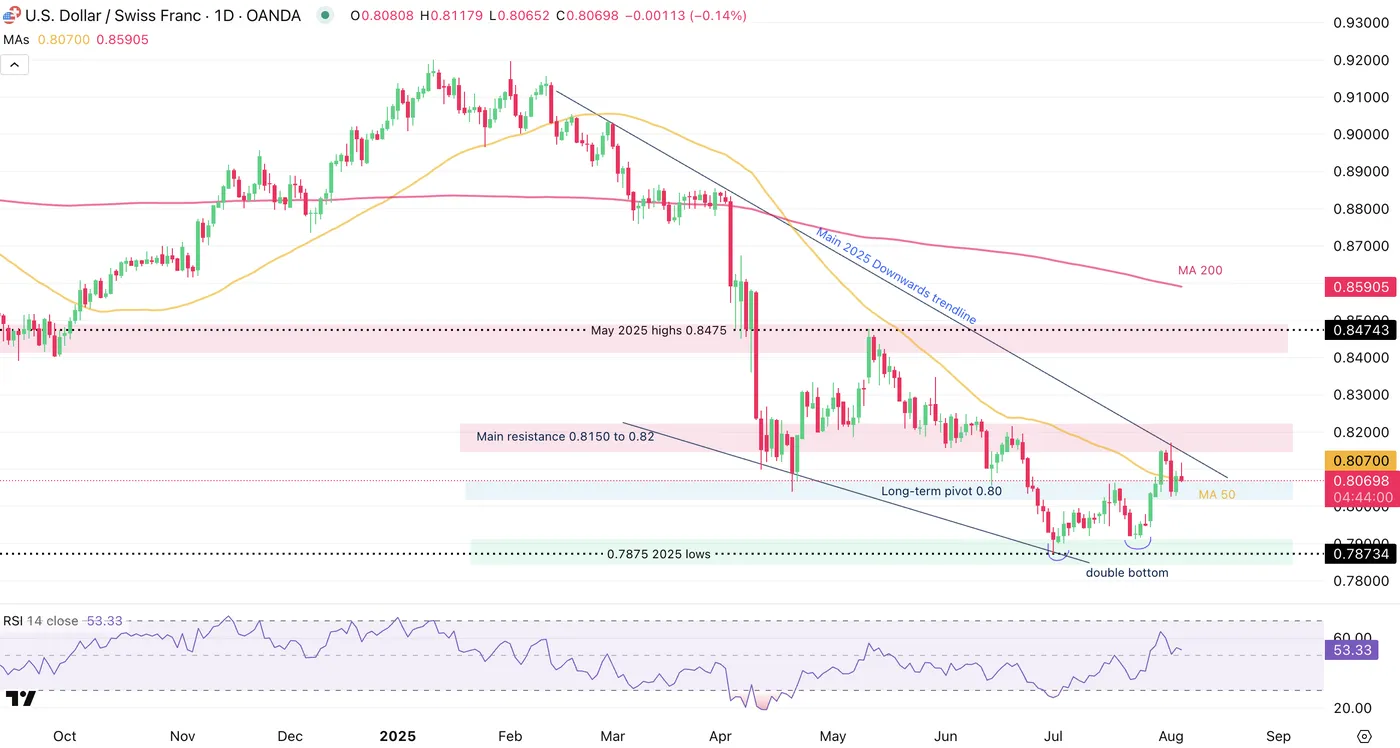
USD/CHF Daily Chart, August 5, 2025 – Source: TradingView
The major pair, which had been in a steep downtrend since the beginning of 2025, has marked a double-bottom on its Daily charts during the month of July after attaining levels unseen since 2011.
Since, the rebound has been consequent but with buyers failing to breach above the 0.8150 to 0.82 Main Resistance, the action is seeing more balance.
Watch the 50-Day MA acting as immediate support to spot if buyers manage to respond to the 2025 Main Descending Trendline, which just acted as a supply zone for USD/CHF Sellers.
The RSI Momentum was rising but is still closer to the neutral level than decisively bullish momentum.
USDCHF 4H Chart
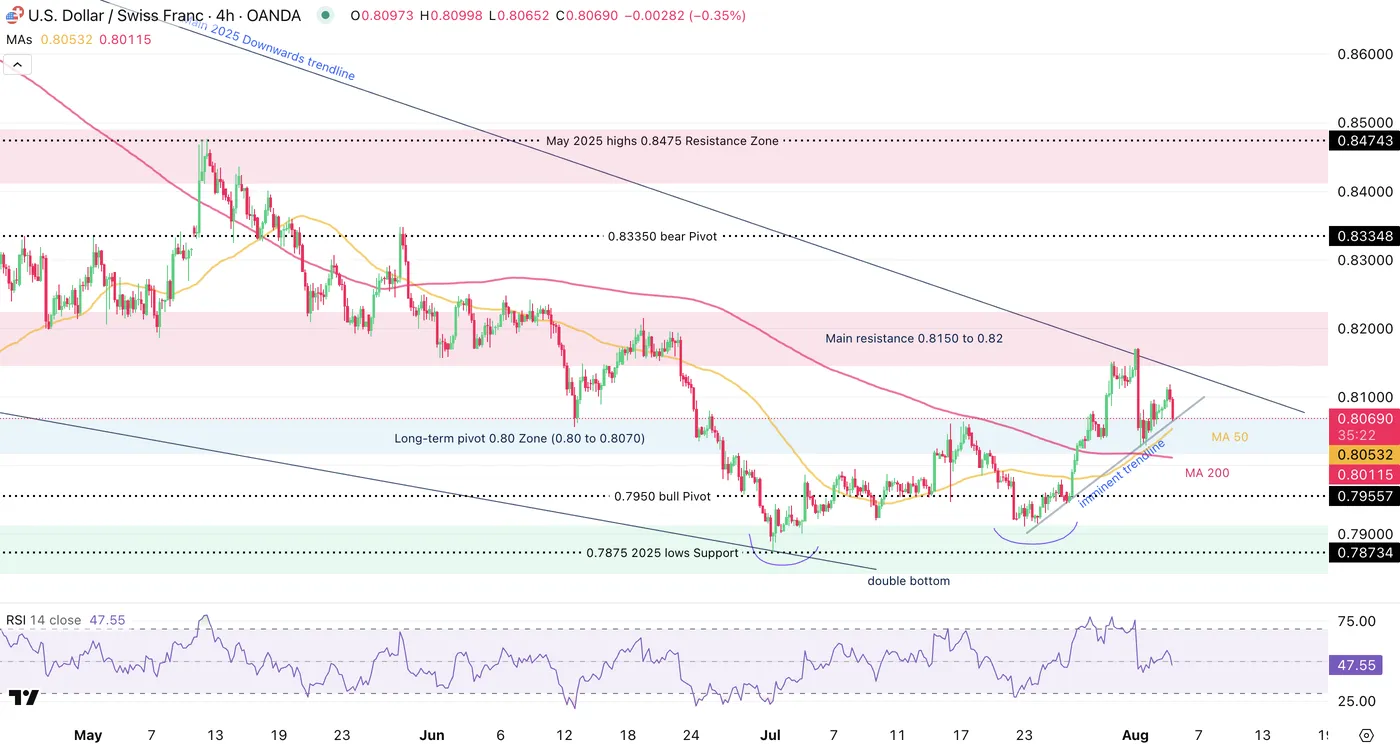
USD/CHF 4H Chart, August 5, 2025 – Source: TradingView
Looking closer, sellers are bringing back the pair into its 0.80 Main Pivot Zone (0.80 to 0.8070), where reactions will be important to monitor.
There are some conflicting signs between the uptrending intermediate trendline formed after the double bottom and the main descending 2025 trend.
Looking at the conflicting price action, there is a high probability of a range forming around the Pivot Zone but it is still far from being confirmed, therefore the pair will have to be watched closely and may move fast depending on risk appetite.
The current price action is currently seller-dominated after this morning’s miss in the US Services PMIs.
Levels to watch for the pair:
Daily Resistance Levels
- Main resistance 0.8150 to 0.82 (last highs 0.8165)
- 0.83350 bear Pivot
- May 2025 highs 0.8475 Resistance Zone
Daily Support Levels
- Long-term pivot 0.80 Zone (0.80 to 0.8070) Confluence with Daily and 4H MA 50
- 0.7950 bull Pivot
- 0.7875 2025 lows
Safe Trades!