
As the chart shows, the Nasdaq 100 index (US Tech 100 mini on FXOpen) fell by approximately 1.6% yesterday.
According to media reports, bearish sentiment has been fuelled by the approach of key events:
→ the release of the FOMC meeting minutes (today at 21:00 GMT+3);
→ Jerome Powell’s speech at the Jackson Hole symposium on Friday. Market participants are preparing for remarks from the Fed Chair on the trajectory of interest rates.
Notably, the S&P 500 declined less significantly, while the Dow Jones remained virtually unchanged. This suggests that:
→ tech stocks are heavily overvalued due to AI-driven hype;
→ capital shifted yesterday from risk assets (including cryptocurrencies) into so-called safe havens.
Could tech stocks continue to decline?
Technical Analysis of the Nasdaq 100 (US Tech 100 mini on FXOpen)
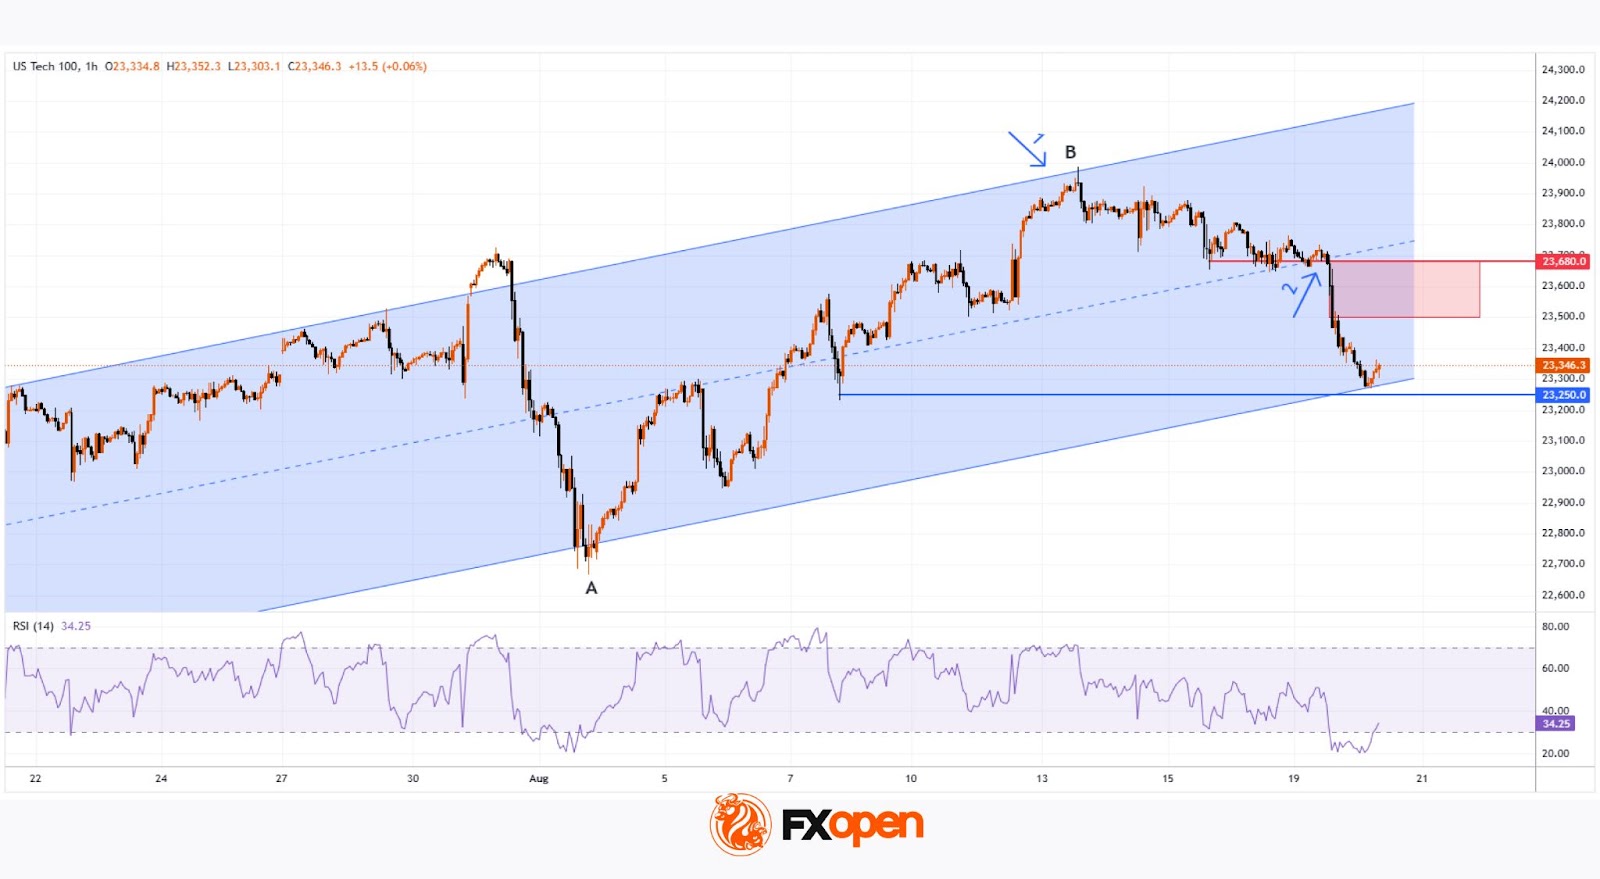
Analysing the Nasdaq 100 index chart (US Tech 100 mini on FXOpen) on 5 August, we plotted the main upward channel (shown in blue). It remains valid, as since then the price has:
1→ reached the upper boundary, which (as often happens) acted as resistance;
2→ retreated to the median line, where volatility decreased (a sign of balance between supply and demand), but only briefly.
Yesterday’s low coincided with the lower boundary of the channel.
From a bullish perspective, buyers might rely on:
→ a resumption of the uptrend from the lower boundary (as was the case in early August);
→ support at the 50% retracement level after the A→B impulse (located around the current price area);
→ a rebound from the oversold zone indicated by the RSI;
→ support at the 7 August low of 23,250 (a false bearish breakout remains possible).
On the other hand: the price has confidently broken through the channel median and then accelerated downwards (a sign of imbalance in favour of sellers). This imbalance zone (which, under the Smart Money Concept methodology, is considered a bearish Fair Value Gap) could act as resistance going forward.
Given the pace of yesterday’s decline, we could assume that sellers currently hold the initiative. Should we see weak rebounds (in the style of a dead cat bounce) from the channel’s lower boundary, the likelihood of a bearish breakout could increase.
Trade global index CFDs with zero commission and tight spreads. Open your FXOpen account now or learn more about trading index CFDs with FXOpen.
This article represents the opinion of the Companies operating under the FXOpen brand only. It is not to be construed as an offer, solicitation, or recommendation with respect to products and services provided by the Companies operating under the FXOpen brand, nor is it to be considered financial advice.


 fell by approximately 1.6% yesterday.)