In this technical article we’re going to look at the Elliott Wave charts of Dollar index DXY published in members area of the website. US Dollar has recently given us Double Three pull back and found buyers again precisely at the equal legs area as we expected. In this discussion, we’ll break down the Elliott Wave pattern and forecast.
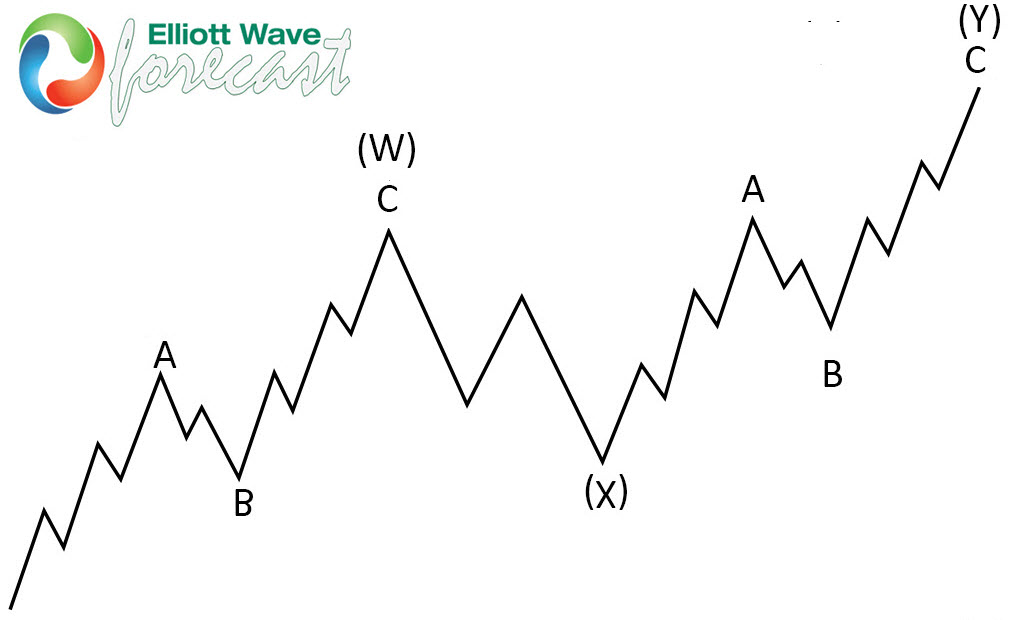
Elliott Wave Double Three Pattern
Double three is the common pattern in the market , also known as 7 swing structure. It’s a reliable pattern which is giving us good trading entries with clearly defined invalidation levels.
The picture below presents what Elliott Wave Double Three pattern looks like. It has (W),(X),(Y) labeling and 3,3,3 inner structure, which means all of these 3 legs are corrective sequences. Each (W) and (Y) are made of 3 swings , they’re having A,B,C structure in lower degree, or alternatively they can have W,X,Y labeling.
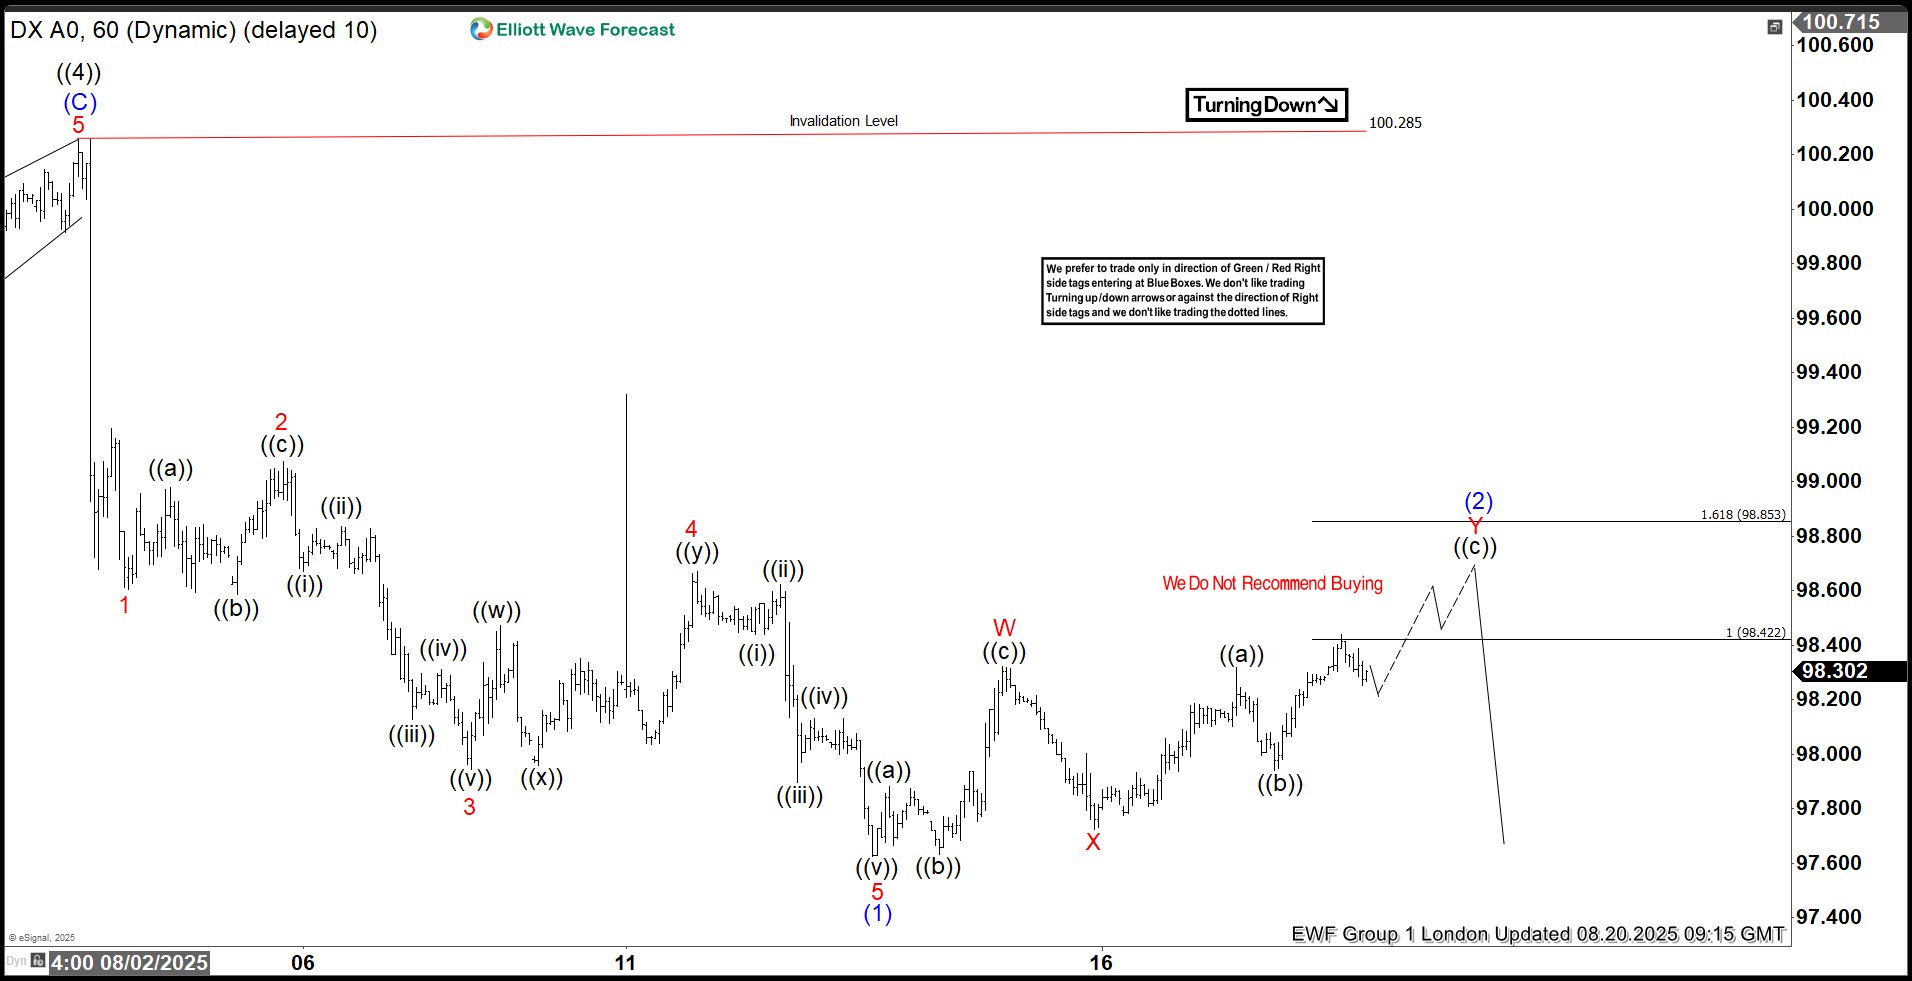
DXY Elliott Wave 1 Hour Chart 08.20.2025
DXY is forming a Double Three pattern. Our members know that we identify potential reversal zones using the Equal Legs technique — in this case, the sellers’ area lies at 98.422–98.853. The dollar may see further upside in the near term within this zone. As long as the price stays within this region, we expect sellers to take control and push it down toward new lows. We recommended that members avoid buying the Dollar at this stage, while favoring the short side.
DXY Elliott Wave 1 Hour Chart 08.20.2025
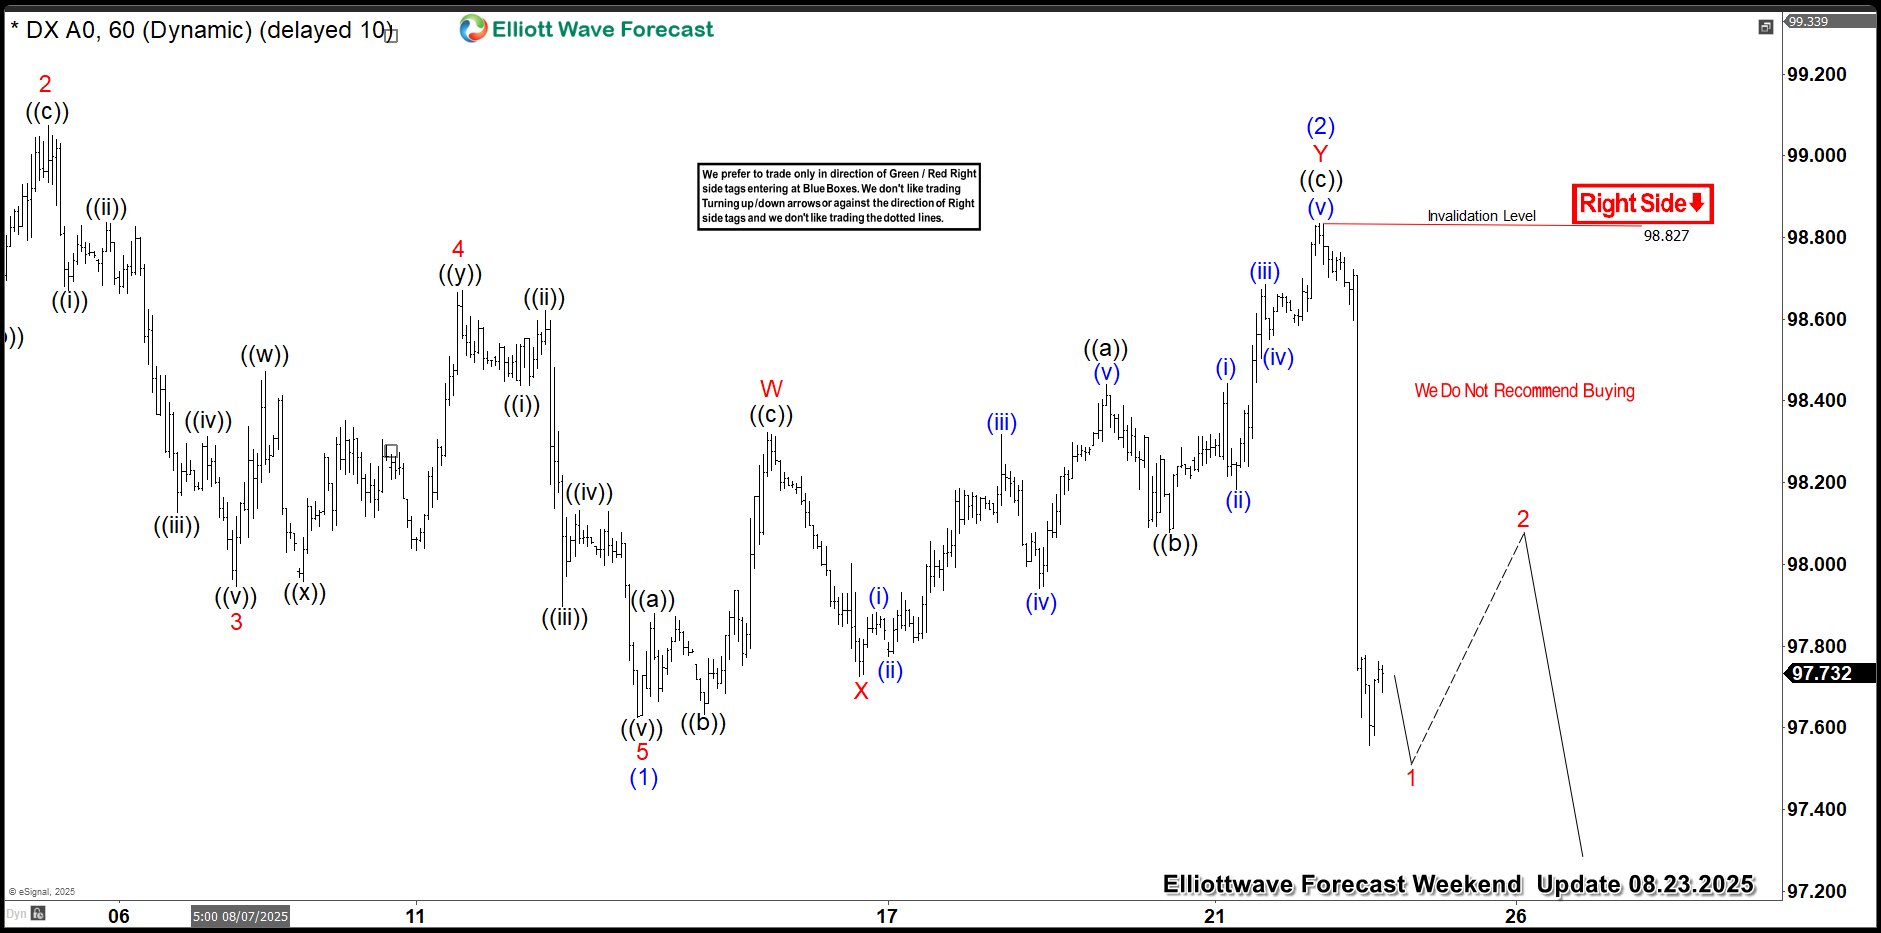
A few days later, we can see the result. The Dollar found sellers at the marked Equal Legs zone, as expected. DXY made a sharp drop from the sellers’ zone. The recovery peaked at 98.827. As long as it remains below that high, the next leg down may be in progress.