
Oil is starting to push higher in a strong move as we speak.
After a seven-day consolidation between $63 and $64, prospects for better war outlooks and lower supply helped Oil prices rise from their lows.
A few days of rise tested the lower bound of the previous month’s range ($65 to $70.5) as Markets sought more information on the Ukraine-Russia conflict.
Despite the previous weeks of geopolitical meetings between the US, Ukrainian, Russian, and EU Presidents, talks have been in limbo, and the lack of progress, combined with repeated assaults by Russia on Kiev, is not helping the situation.
The German Chancellor Merz just announced that there would be no Zelenskyy-Putin talks, not a big surprise when looking at the lack of headlines going towards that direction.
That comes despite US’s Kellogg trying to make things sound better than they really are.
Discover technical levels for WTI trading as price are shooting higher.
US Oil Daily Chart
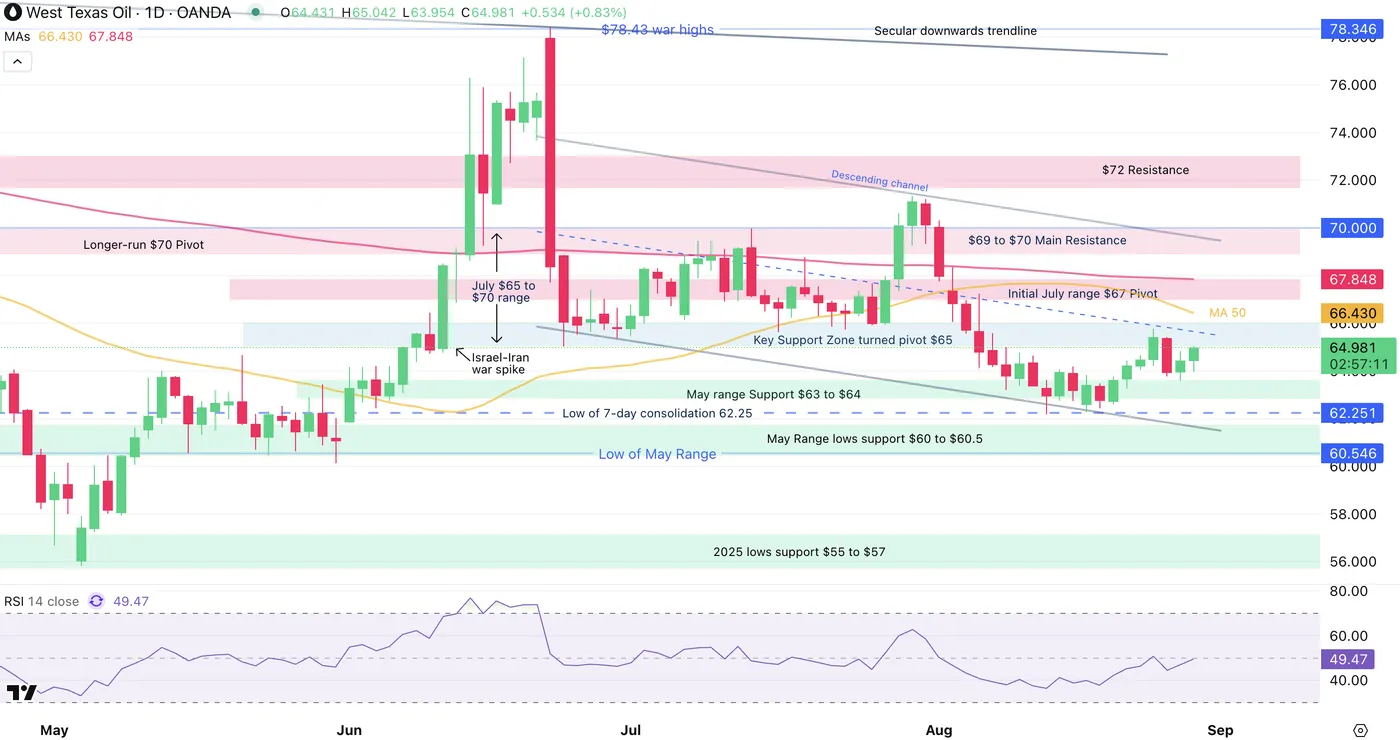
US Oil Daily Chart, August 28, 2025 – Source: TradingView
The most recent lows in the commodity allowed the formation of an intermediate downward channel, with prices starting to shoot since the last technical rebound.
Some accumulation had led to a breakout which stopped at $65.77 highs on Monday, but the fundamentals not progressing have led to the ongoing rally.
Sanctions on India have been re-iterated by US President Trump and it seems that economically pressuring Russia into a ceasefire will be one of the only ways to reach some type of truce.
The President was saying nice words too early, with the mess-around talks of Putin coming to watch football at the World Cup.
As I am writing this, Bulls are pushing within the $65 Zone.
US Oil 4H Chart
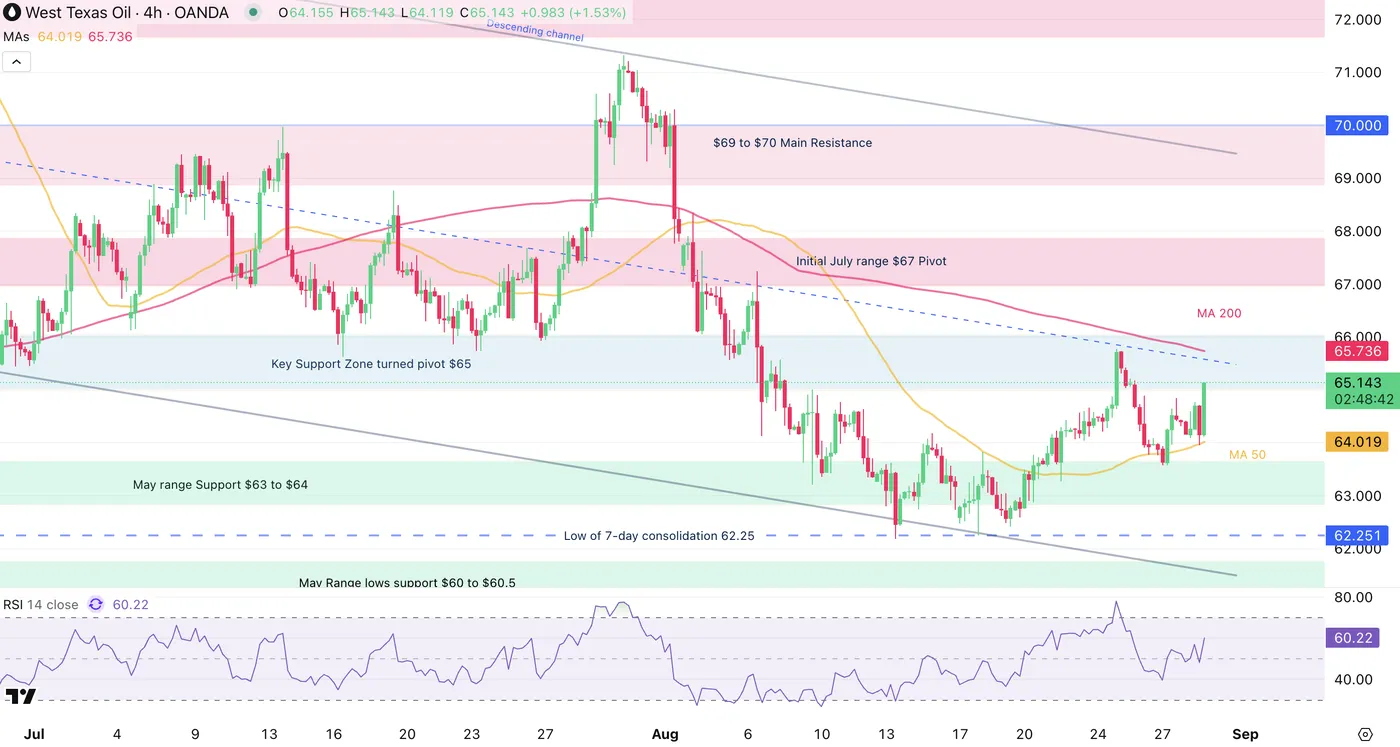
US Oil 4H Chart, August 28, 2025 – Source: TradingView
Bullish momentum is building in the ongoing bullish candle – the latest headlines seem to attract buyers.
Look at a break above the 200-period 4H MA, a break above should attract even more buying.
Level to place on your WTI Charts:
Resistance Levels
- $65 Pivot Zone (getting tested right now)
- Monday highs and 200 4H-MA 65.70
- $66 to $67 Mid-range level
- high range resistance $67.30 to $68 – Confluence with 50 and 200 Day MAs
Support Levels
- $62.00 to $62.50 consolidation support
- Wednesday lows $62.19 (current double bottom)
- $60.5 Low of May Range
- $55 to $57 2025 lows Main support
US Oil 1H Chart
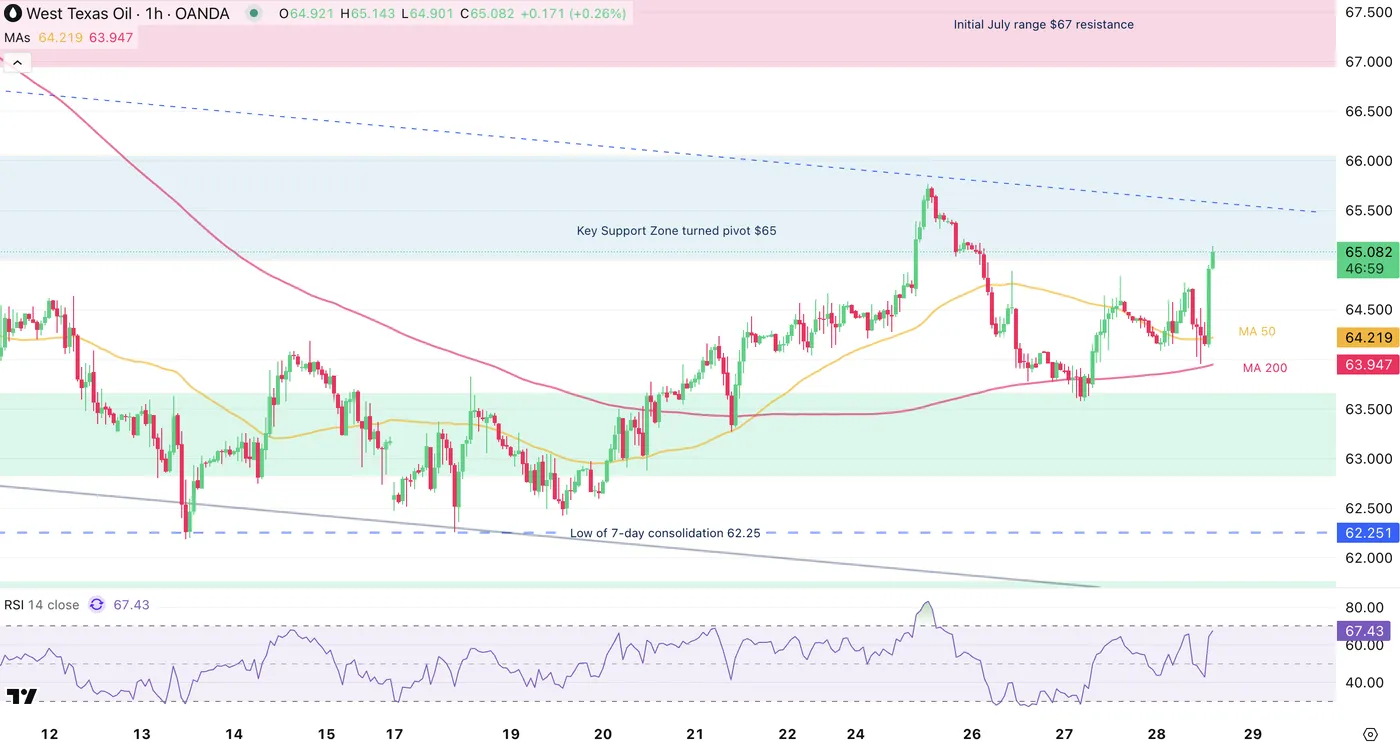
US Oil 1H Chart, August 28, 2025 – Source: TradingView
The current move is strong, watch for potential continuation if the move keeps on going.
It seems that some decent short-selling has been accumulated in the past weeks, and a short-squeeze could come into play – keep an eye on the 4H 200-period MA mentioned above.
Safe Trades!