.)
Dow Jones index: ⬇️ Sell
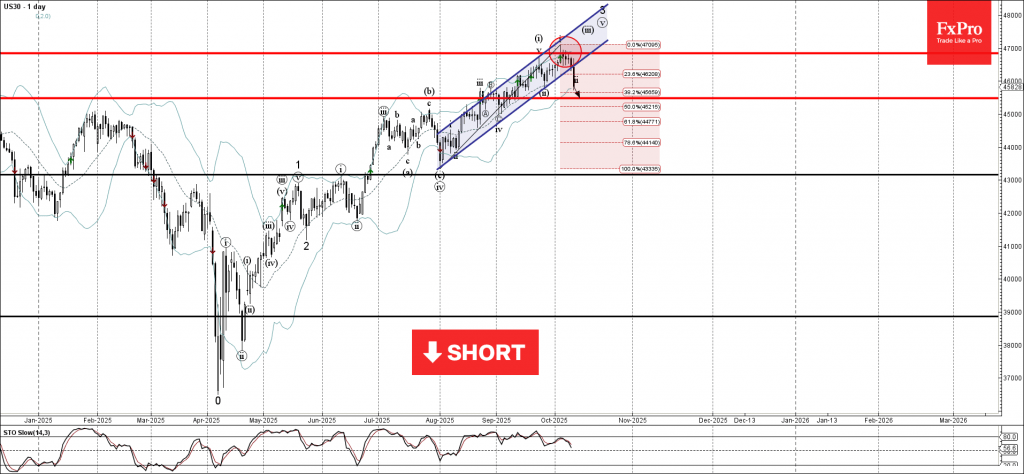
- Dow Jones index broke daily up channel from
- Likely to fall to support level 45470.00
Dow Jones index recently broke the daily up channel from end of July – which was preceded by the downward reversal from the key resistance level 46775.00 (former monthly high from last month).
The breakout of this up channel from accelerated the active short-term downward correction ii from the start of October from resistance level 46775.00.
Given the strength of the resistance level 46775.00 and the bearish divergence on the daily Stochastic indicator, Dow Jones index can be expected to fall to the next support level 45470.00 (target price for the completion of the active correction (ii)).