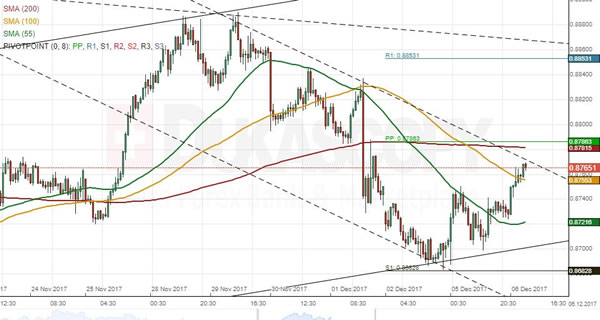
A descending channel has confined NZD/CAD since late August. The latest test of its bottom boundary occurred on November 17 when the New Zealand Dollar reversed to the upside and formed a channel up. In line with this pattern, the pair should still appreciate up to the 0.89 area where the upper boundaries of this pattern and the senior one are located. However, the Kiwi faces a significant resistance cluster set by the weekly and monthly PPs and the 200-hour SMA in the 0.8780/0.8800 territory. As suggested by technical indicators, this might mark a point of reversal. In this case, the Kiwi is likely to breach the channel up and continue trading in a newly-formed one-day channel down towards the bottom boundary of the senior pattern. The nearest support of significance is the 55-hour SMA at 0.8723; the weekly and monthly S1s are likewise located nearby circa 0.8670.