
 has stalled its gigantic rally higher as a more hawkish Fed pricing and lower economic projections have effectively brought a top to the precious industrial metal.)
Silver (XAG/USD) has stalled its gigantic rally higher as a more hawkish Fed pricing and lower economic projections have effectively brought a top to the precious industrial metal.
After forming a clear double top at its all-time highs of $54.50, Silver retraced lower to just graze below the psychological $50 mark.
Still, the metal’s resilience to correct lower suggests that the underlying dovish catalysts haven’t entirely disappeared.
NY Fed President John Williams recently revived hopes for a 25 basis point cut, pushing the odds for the December meeting back up to around 70%.
This pricing was further consolidated by a raft of weak data released this morning: PPI came in at 2.7% (matching expectations), while both Retail Sales and the ADP Private Employment report surprised to the downside.
Hence, the prospect of gradual rate easing—a fundamental booster for commodities like Silver—keeps underpinning prices even as sellers try to push lower.
Marking a recent low at $48.65 but also failing to breach the $52 level, a range is gradually forming.
Let’s look at it through a multi-timeframe analysis of the metal.
Silver (XAG/USD) Multi-timeframe Technical Analysis
Daily Chart
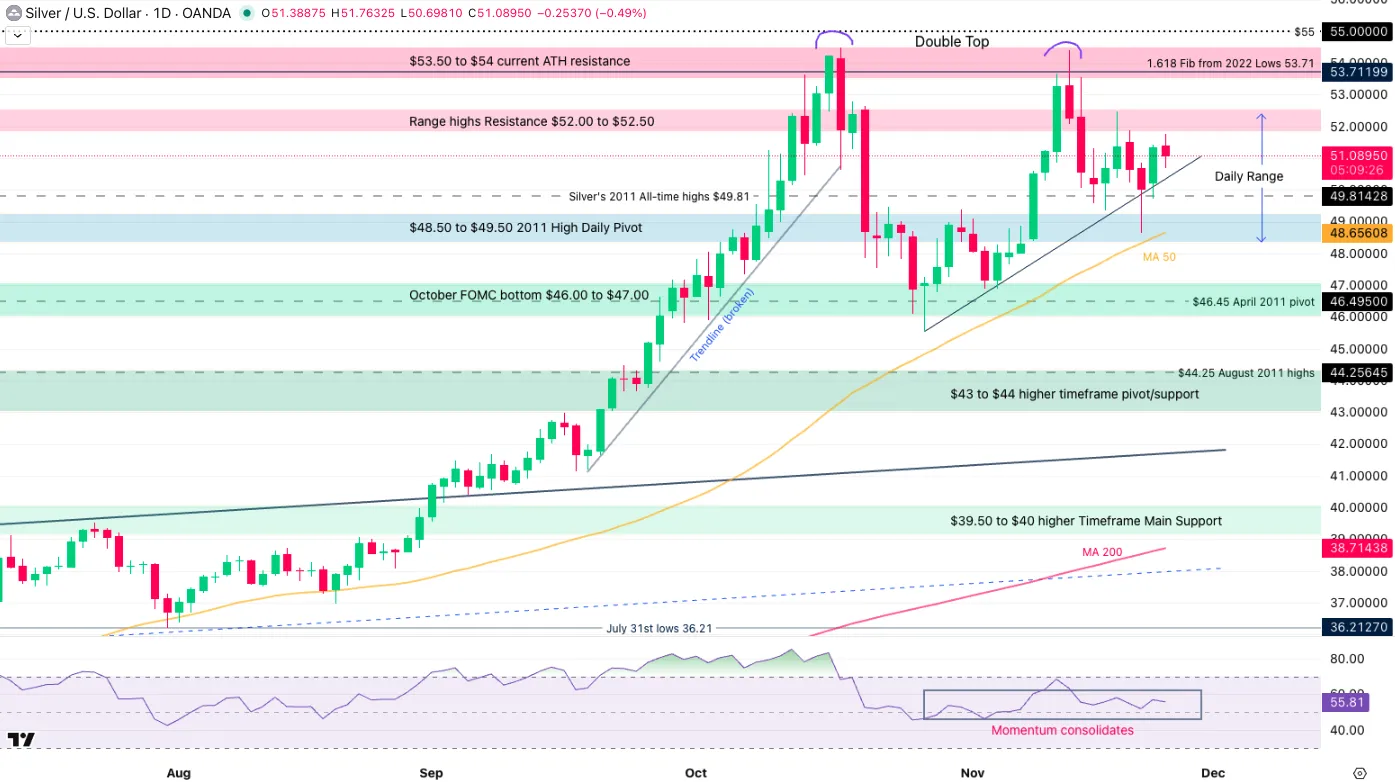
Silver (XAG/USD) Daily Chart, November 25, 2025 – Source: TradingView
After yesterday’s strong rebound back above the $50 mark, buyer hesitancy and another failed test of the $52.00 level proves how weak directional attempts are.
This is characteristic of a Thanksgiving week, when many traders are absent and leads to lower odds of trending-environment (Who will be there to push prices?).
When looking at the past few weeks of action, the up-down action forms typical signs of a range.
It also gets confirmed further when looking at the long wicks, and a flattening RSI right around the neutral zone.
Let’s dive into shorter timeframe to spot more details on how to exploit this range.
4H Chart and Technical Levels
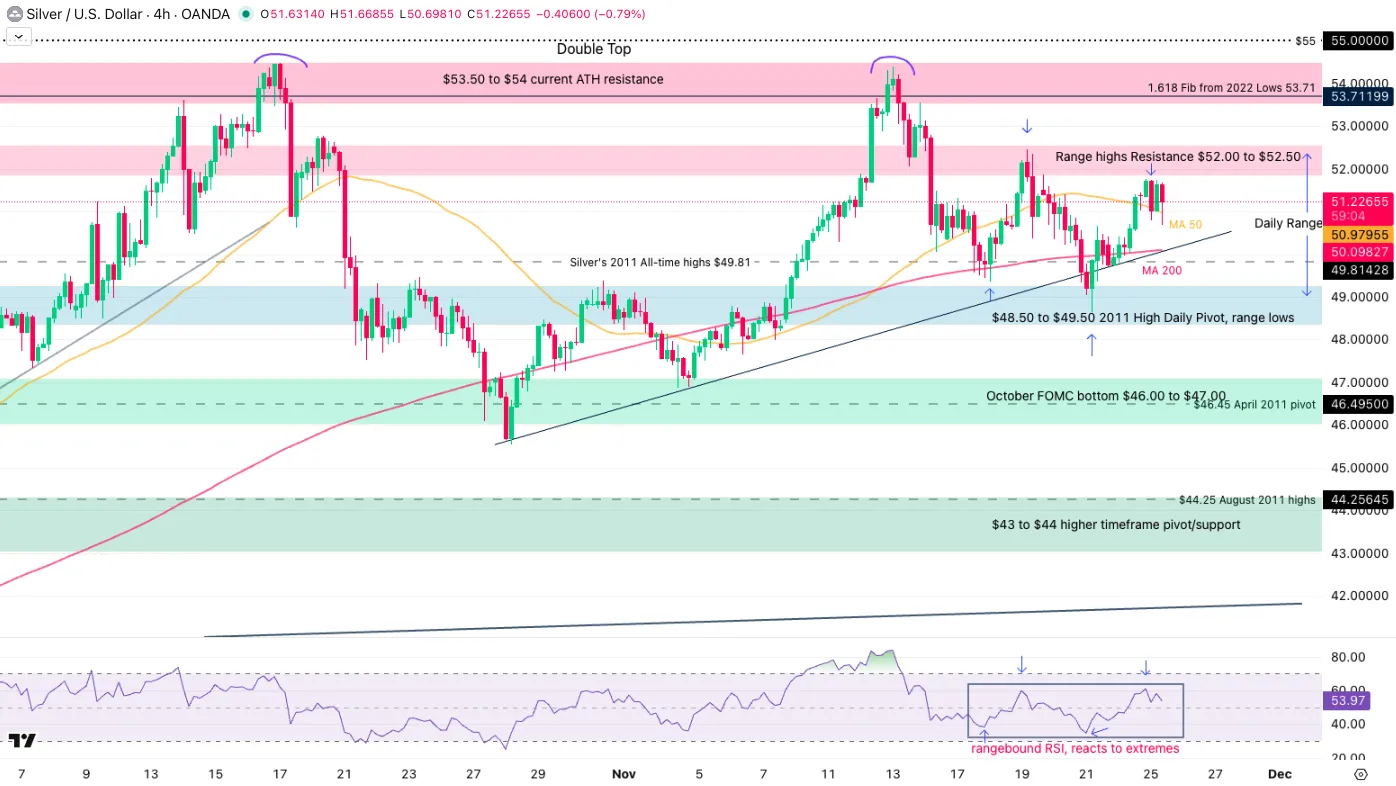
Silver (XAG/USD) 4H Chart, November 25, 2025 – Source: TradingView
Levels to watch for Silver (XAG) trading:
Resistance Levels:
- Range highs Resistance $52.00 to $52.50
- 2025 record $55.48
- $53.50 to $54 current ATH resistance
- $52.47 past week highs
- Potential resistance 1 $57.50 to $60 (1.382% from 2022 lows)
Support Levels:
- $48.50 to $49.50 Daily Pivot, Range lows
- October FOMC bottom $46.00 to $47.00
- $45.55 October 28 lows
- $43 to $44 higher timeframe pivot/support
- $39.50 to $40 higher timeframe support
1H Chart
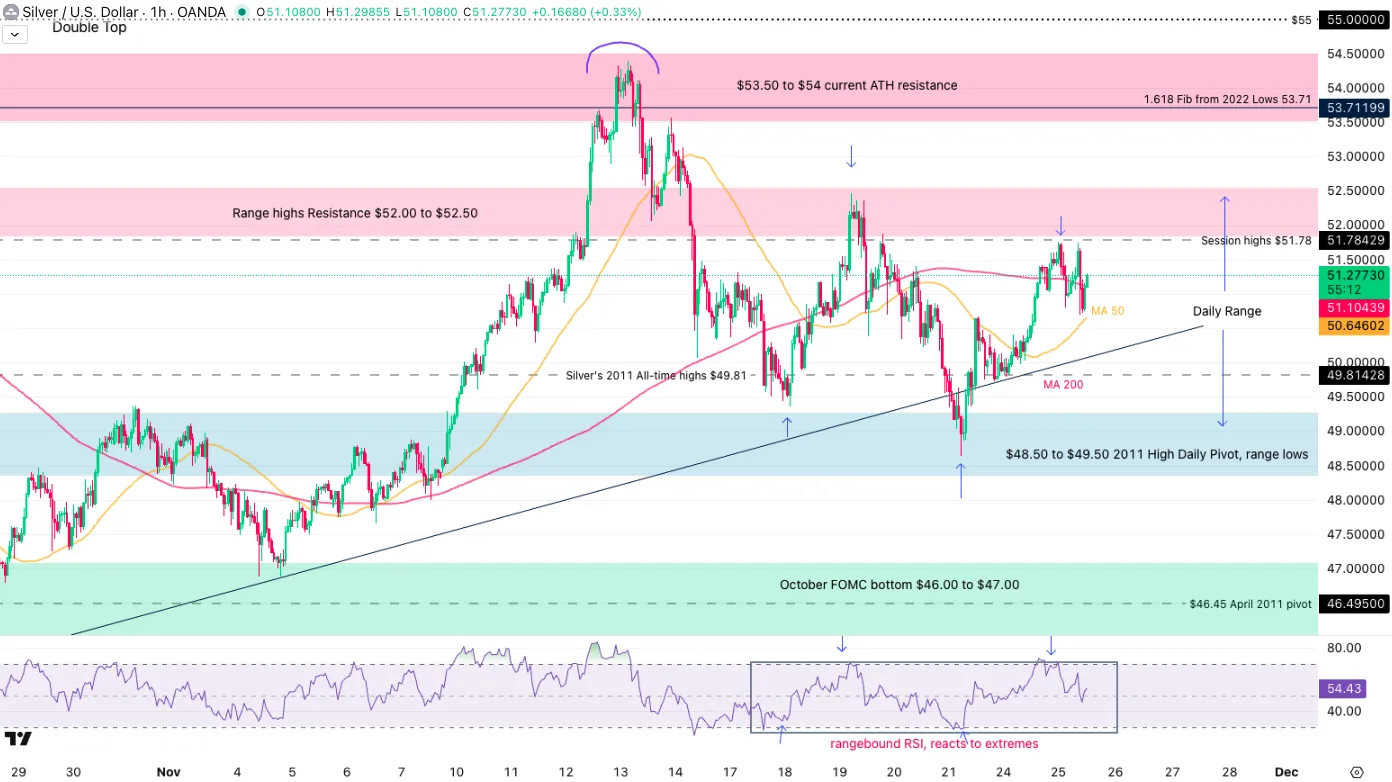
Silver (XAG/USD) 1H Chart, November 25, 2025 – Source: TradingView
The current $48.00 to $52.00 range has found root in more troubles fundamentals as time comes:
Is the Fed lowering rates enough to fuel another All-time high rally?
Are ongoing geopolitical reconciliations enough to lower demand and bring prices down?
As traders and participants scratch their heads, an opportunity to trade the range emerges.
- Sell the $52.00 to $52.50 resistance; Wait for a candle rejecting the level and spot if selling continues.
- Buy the $48.00 to $49.00 range lows to play the range.
- Track for daily closes above and below these range levels to see if flows create a diversion from the ongoing consolidation
Safe Trades!