
Silver posted its strongest weekly gain since 1998, surging 18%, driven by the “China factor”—specifically, Beijing’s announcement of mandatory export licensing effective from 2026. This echoes the 1979 silver squeeze, when inflation soared and the Hunt brothers attempted to corner the market.
An ounce of silver now costs more than a barrel of oil, and daily trading volume in the SLV ETF reached USD 9.6 billion, a frenzy not seen since the peaks of 2011 and 2021. Octavio Costa of Crescat Capital even interprets this rally as a sign of hidden hyperinflation, largely overlooked by mainstream financial media.
The shift in sentiment has been extraordinary: silver has outperformed the British pound in market capitalisation terms and has soared 300% since October 2022, outpacing even high-flying AI stocks—a potent signal of speculative excess. However, the precious metals complex sold off sharply in the latter part of the session, with silver reaching a new daily low despite holding gains during Asian hours. The move appeared driven by forced short covering, a phenomenon often seen near market tops.
Underlying the volatility, silver inventories remain critically low, posing a potential supply threat to several key industries that rely on the metal in manufacturing.
Technical Analysis: XAG/USD
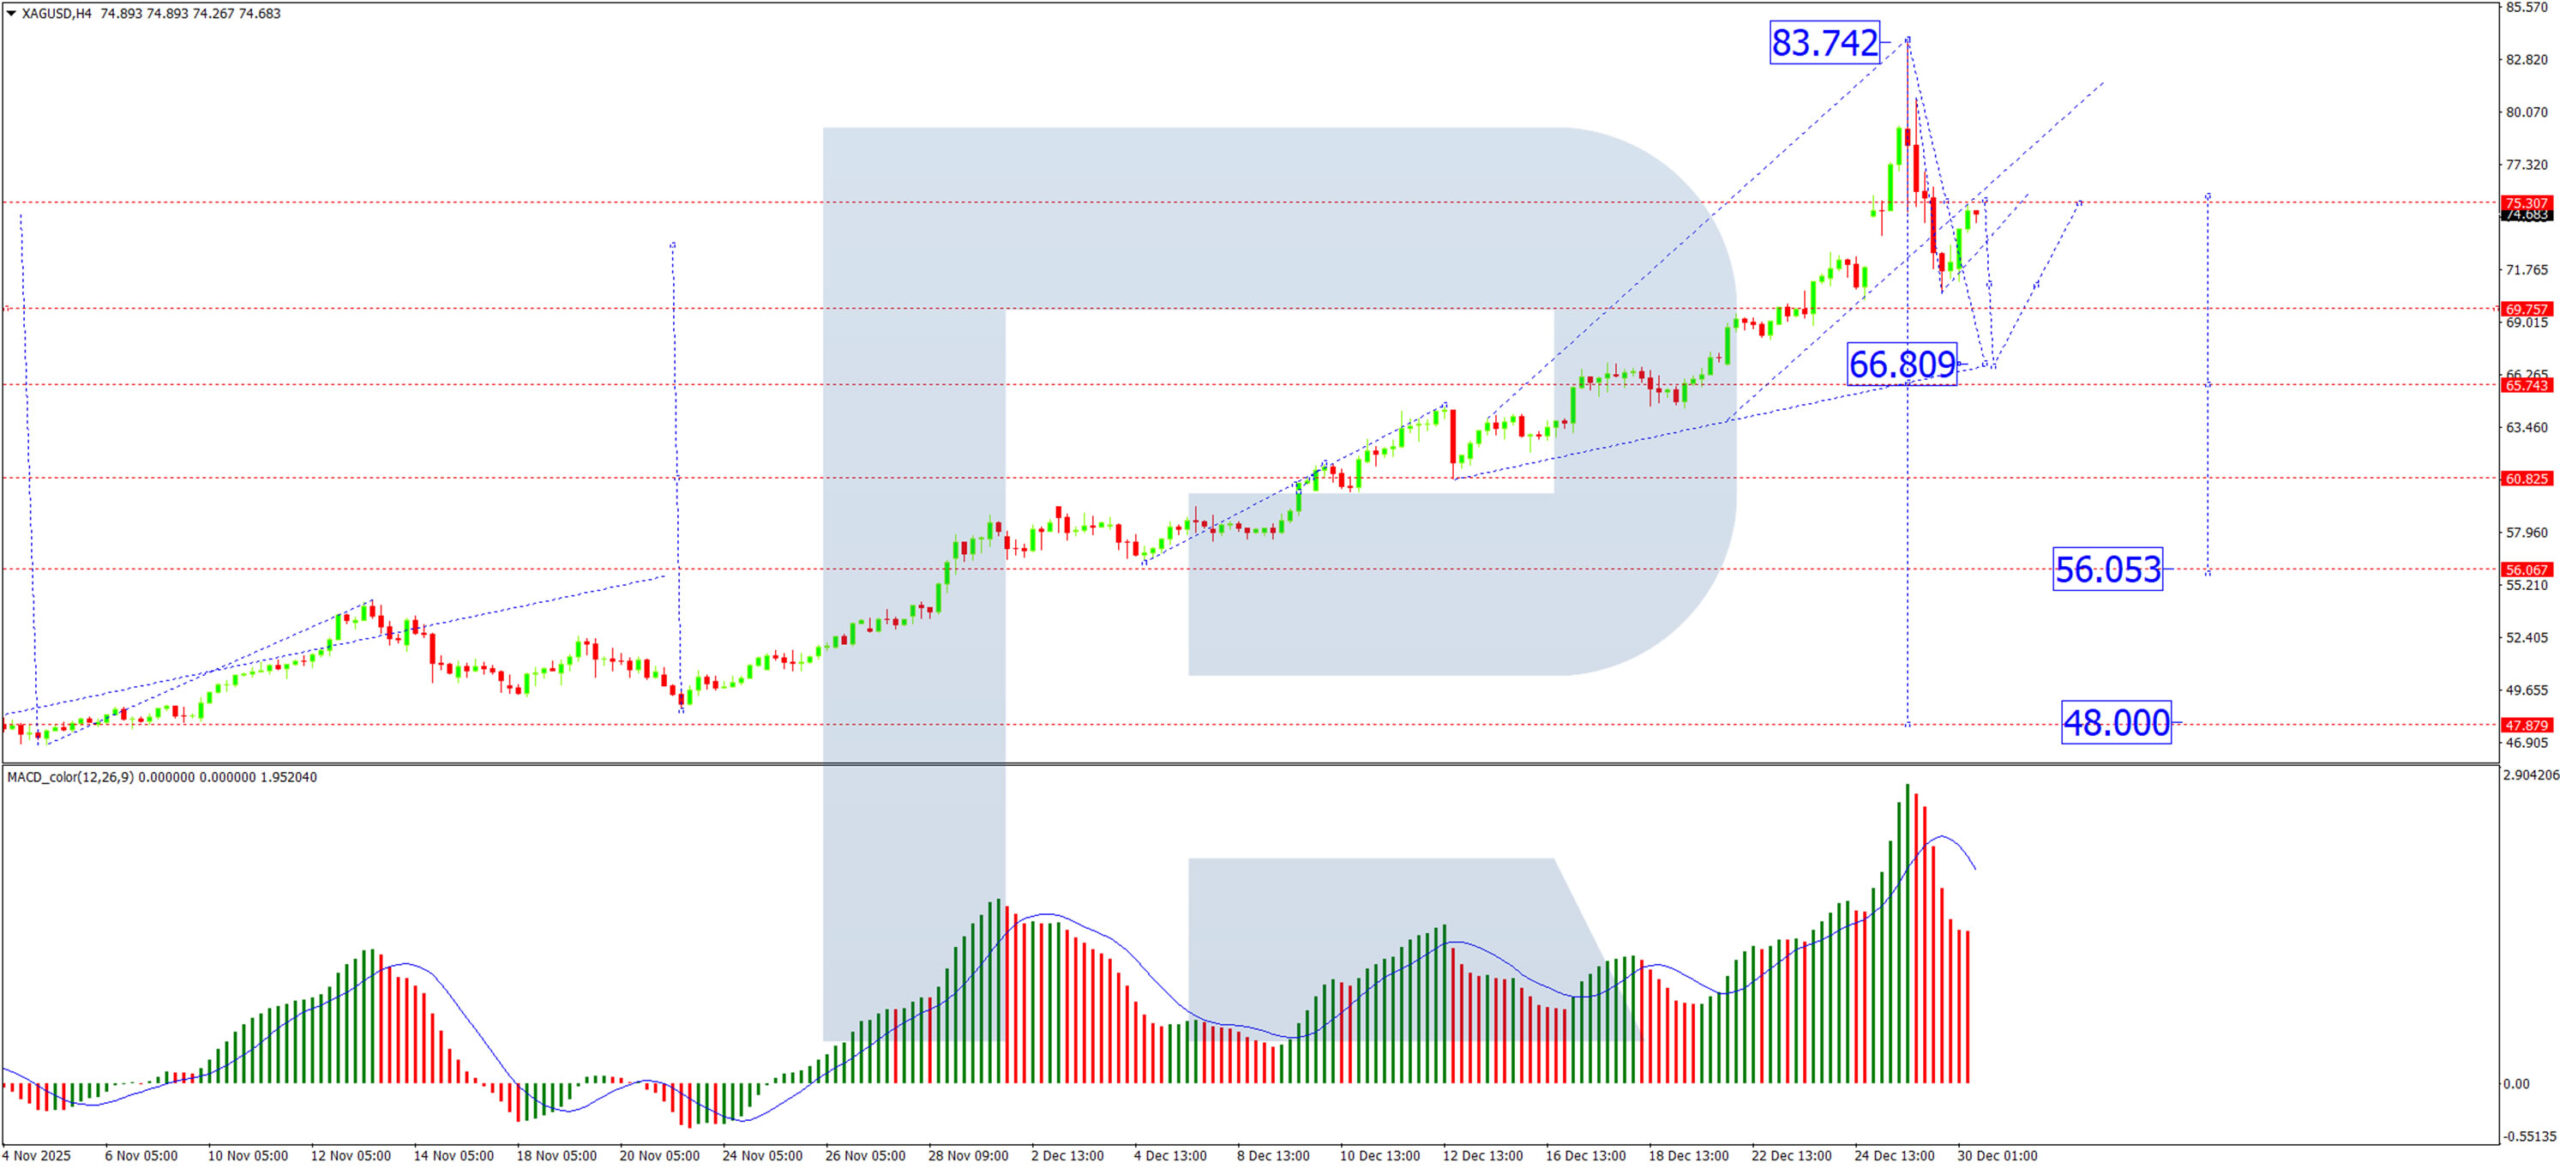
H4 Chart:
On the H4 chart, XAG/USD completed an impulsive wave up to 83.70 USD. The market is now developing a corrective decline toward 66.80 USD. Upon reaching this level, a subsequent upward wave toward 75.30 USD may materialise.
The MACD indicator supports the near-term bearish view, as its signal line—positioned above zero but having diverged from the histogram—suggests further downside momentum.
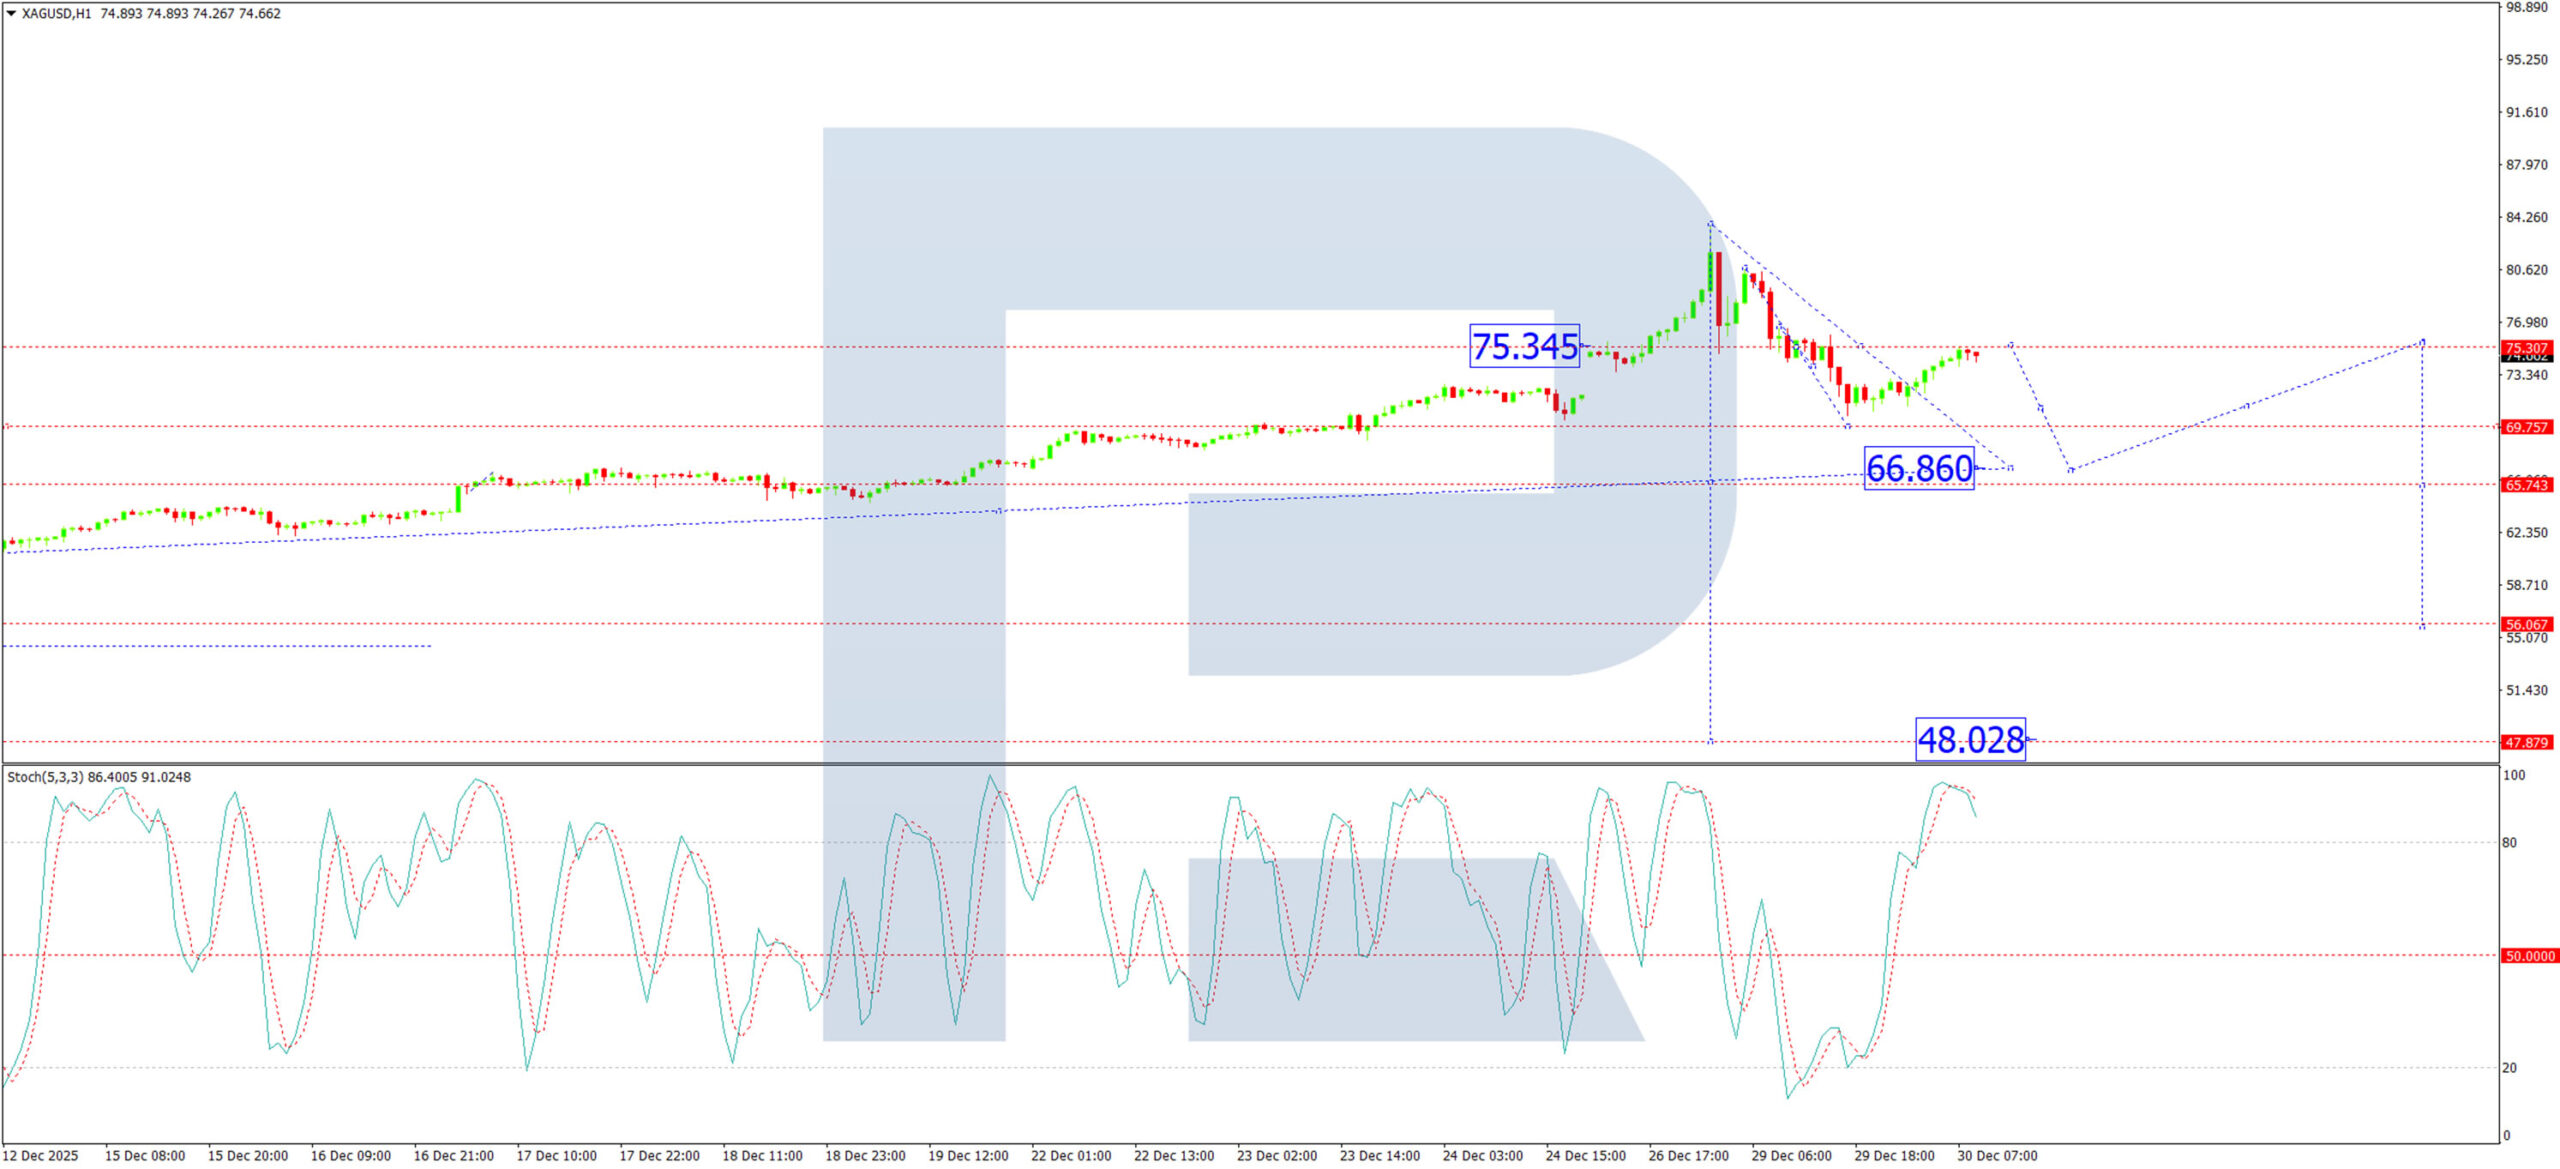
H1 Chart:
On the H1 chart, silver completed a downward impulse to 74.85 USD, followed by a correction to 80.60 USD. The market is currently forming another bearish impulse targeting 69.90 USD. A corrective bounce toward 75.30 USD is expected afterward, potentially setting the stage for another leg lower toward 66.80 USD.
The Stochastic oscillator aligns with this outlook, with its signal line above 80 but turning decisively downward.
Conclusion
Silver’s parabolic rise and subsequent sharp correction highlight extreme volatility and speculative positioning. While long-term fundamentals—including structural supply deficits and industrial demand—remain supportive, the near-term technical picture points to further downside toward 66.80–69.90 USD. The current pullback may offer a healthier foundation before the next sustained rally, but traders should monitor inventory data and Chinese policy signals closely. Expect elevated volatility to persist as the market digests recent extremes.
Disclaimer:
Any forecasts contained herein are based on the author’s particular opinion. This analysis may not be treated as trading advice. RoboForex bears no responsibility for trading results based on trading recommendations and reviews contained herein.