
Cryptocurrencies have been getting whiplashed, with investors noting a stark contrast: despite immense growth in Stock Indexes and Metals, the year-over-year performance for Bitcoin in 2025 was actually negative.
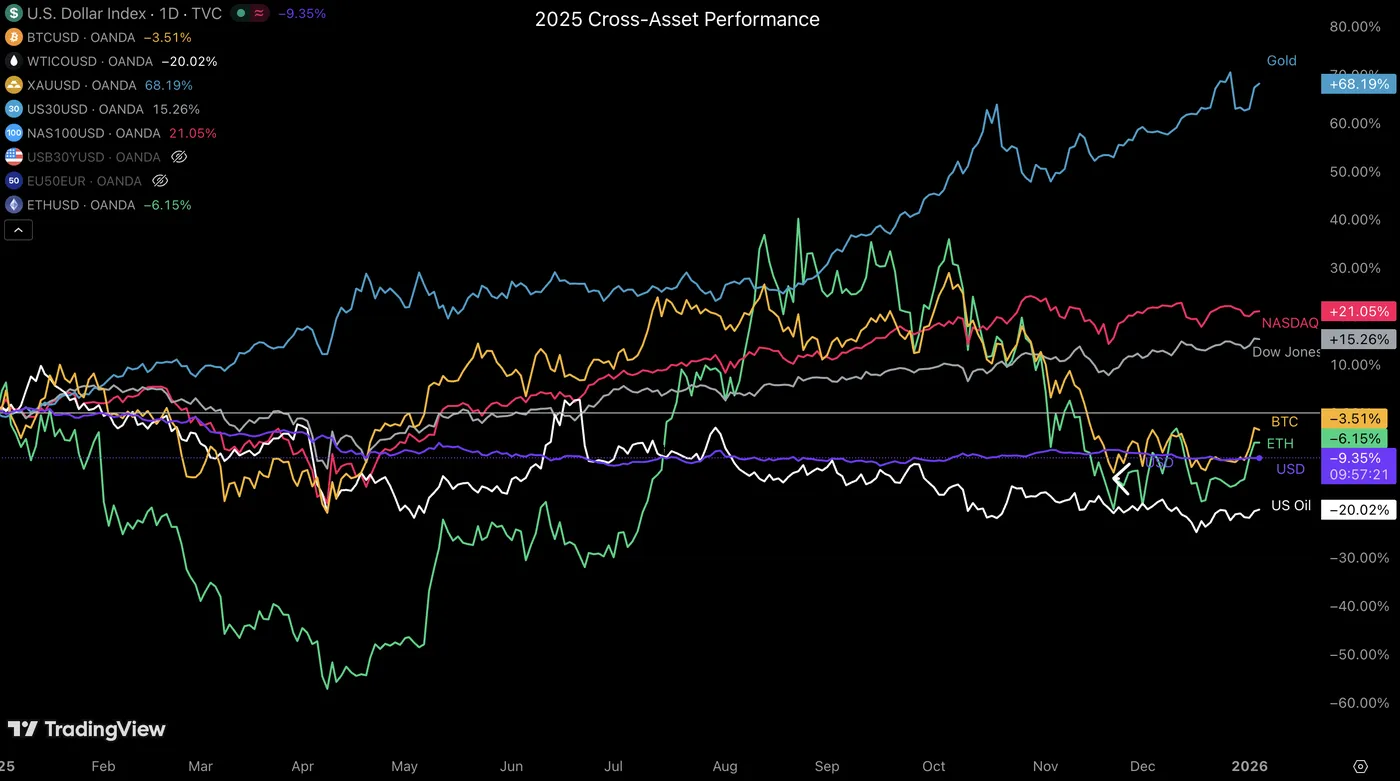
Cross-Asset Market Performance in 2025 – Source: TradingView
But this headline carries a significant bias.
First, year-over-year change fails to capture the total volatility and opportunity within the period. Bitcoin, for example, surged from $75,000 to a new record high of $126,000—a 70% rise from trough to peak.
Traders with a solid game plan who capitalized on these swings fared far better than the yearly close suggests.
It is also worth remembering that the crypto pioneer is still up a staggering 480% since its 2023 lows and 123% since 2024, despite finishing 2025 down 3% overall.
In a similar vein, Ethereum experienced high-volatility flows, rallying 250% to reach new all-time highs of $4,950 in August before correcting.
While it closed the year down roughly 3% compared to January 1st, 2025, it remains up 260% from its 2023 lows.
With the implementation of the Fusaka upgrade—enabling significantly cheaper transaction costs and higher efficiency—the second-largest cryptocurrency could see a fundamental “demand floor” that would act as cushion against more downside.
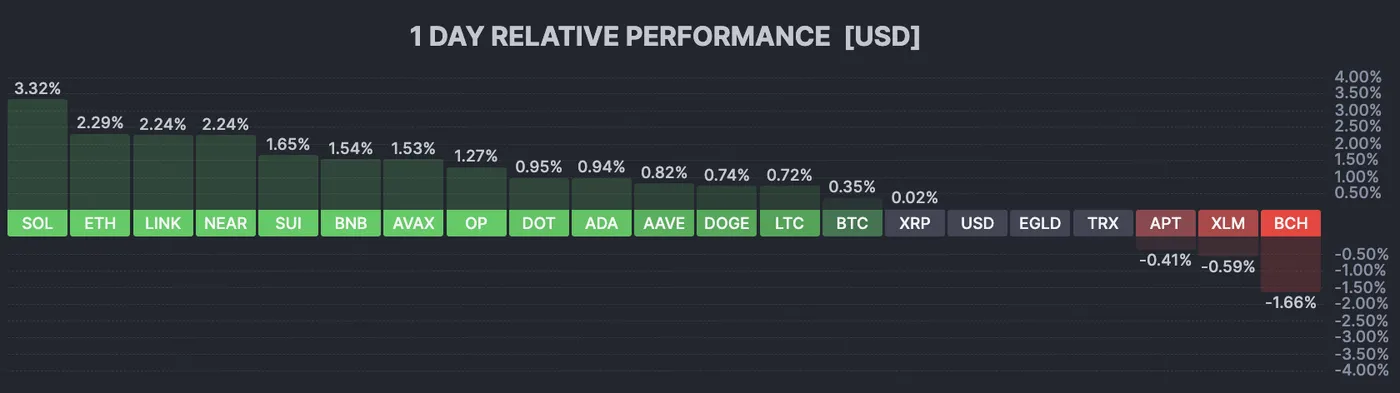
Current Session in Cryptos – January 6, 2026 (10:30). Source: FInviz
Furthermore, Bitcoin wasn’t the only game in town. Several altcoins posted remarkable gains in 2025, decoupling from the majors.
- Binance Coin (BNB): Up 40%.
- Monero (XMR): Up 136%.
- ZCash (ZEC): Up a massive 860%.
The most successful traders were those who leveraged these swift gains, cashing out at relative highs before re-entering at the recent lows.
The question now is where things go in 2026. Risk appetite remains stable, so in the absence of violent volatility, regular discounted cash flows into cryptocurrencies make sense at these levels. You can check our
Solana, for instance, could present an interesting alternative, currently trading 50% off its lows.
Let’s dive right into the Daily Charts and technical levels for Bitcoin (BTC), Ethereum (ETH), and Solana (SOL).
A quick Glance at the Crypto Market Cap from 2019 to 2026
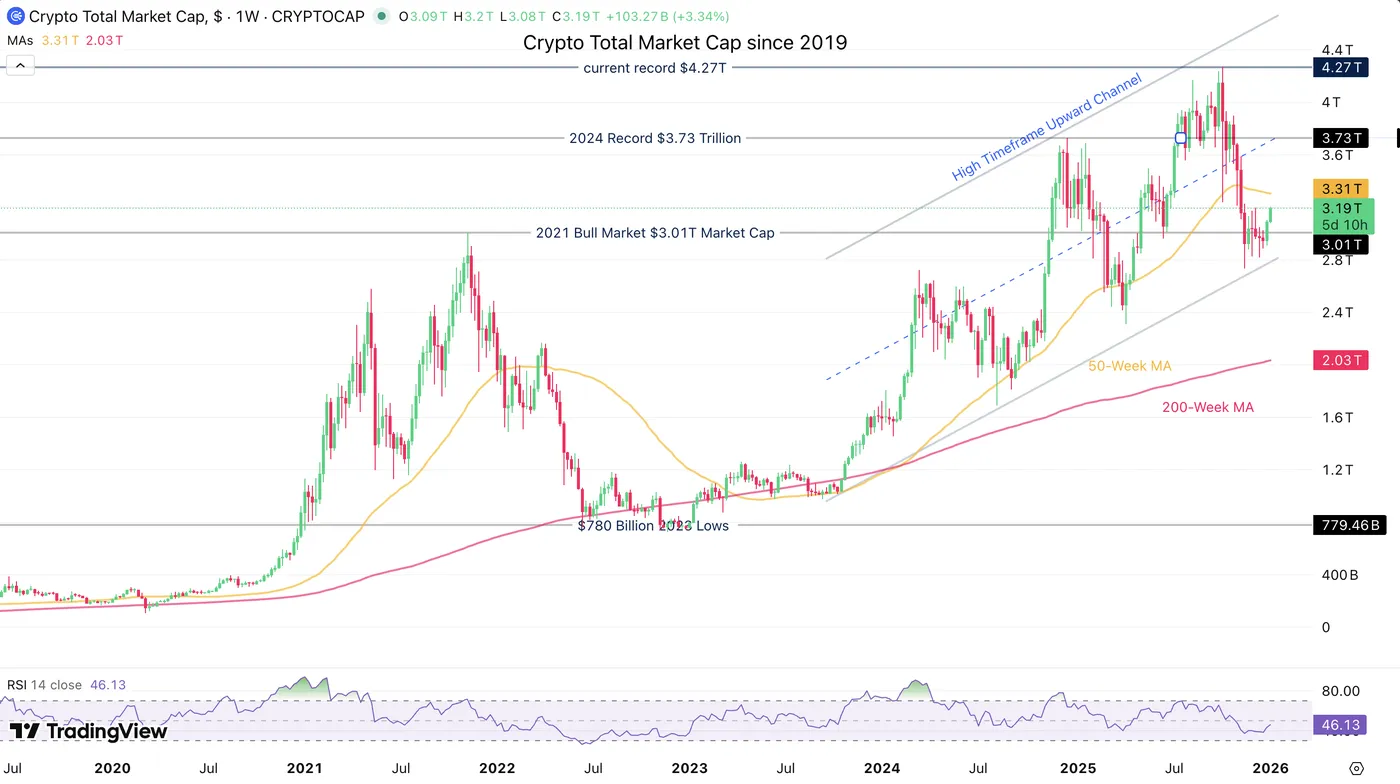
Total Crypto Market Cap Weekly Chart, rebounding from its Channel lows – Source: TradingView
Keep an eye on if the rebound on the higher timeframe upward channel triggers further buying from here.
Overall, the Crypto Market remained very resilient at its lower bound.
Bitcoin (BTC) Daily Chart and Technical Levels
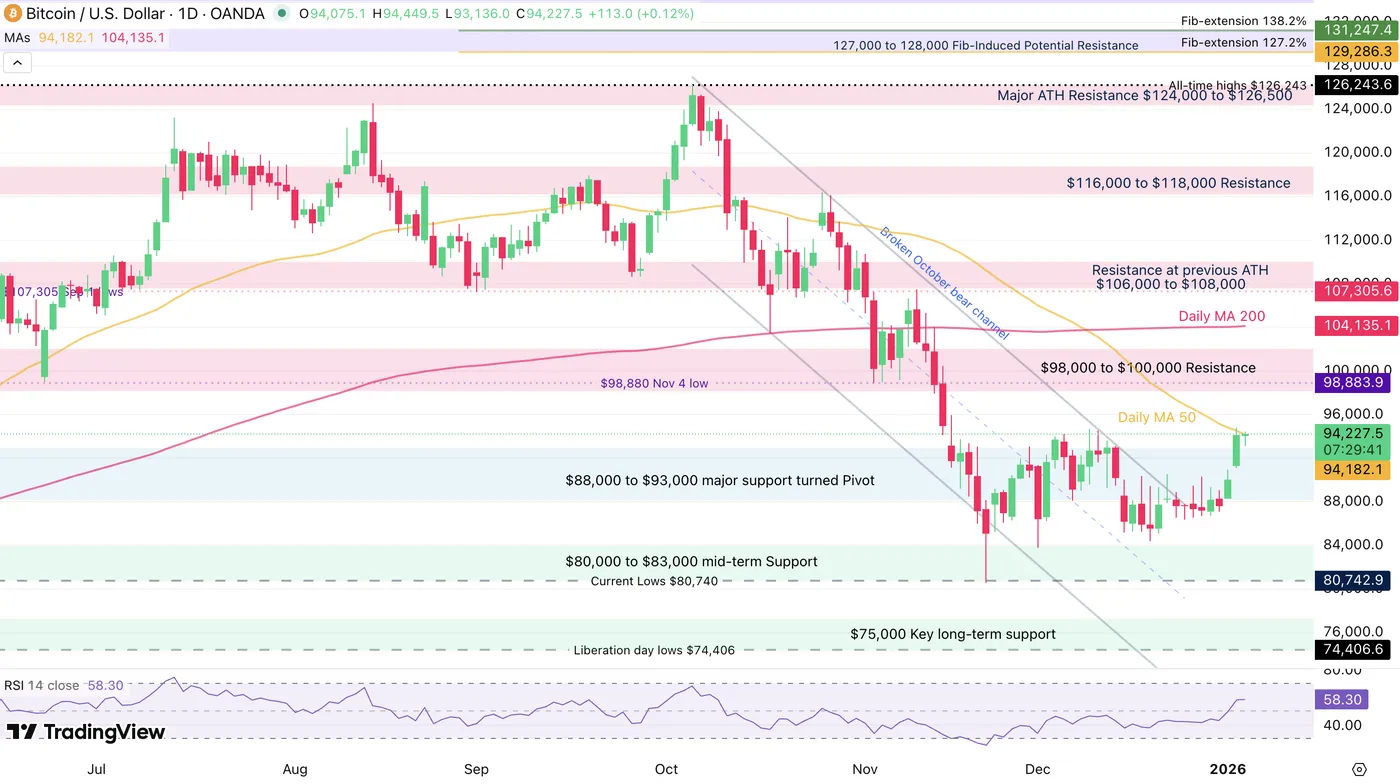
Bitcoin (BTC) Daily Chart, January 6, 2026 – Source: TradingView
Bitcoin is getting back on a bullish momentum but faces a key test at its 50-Day Moving Average, currently at $94,180.
Closing above on the daily would further confirm its breakout beyond its harsh October downtrend. The main Crypto is still not out of its neutral outlook until it breaches the $100,000 level again.
Levels of interest for BTC trading:
Support Levels:
- $88,000 to $93,000 major support turned Pivot
- Current Weekly Lows $89,340
- $85,000 mid-term Support (+/- $1,500)
- $75,000 Key long-term support
Resistance Levels:
- $94,170 50-Day MA
- $98,000 to $100,000 Resistance
- $104,000 200-Day MA
- Resistance at previous ATH $106,000 to $108,000
- Current ATH Resistance $124,000 to $126,000
Ethereum (ETH) Daily Chart and Technical Levels
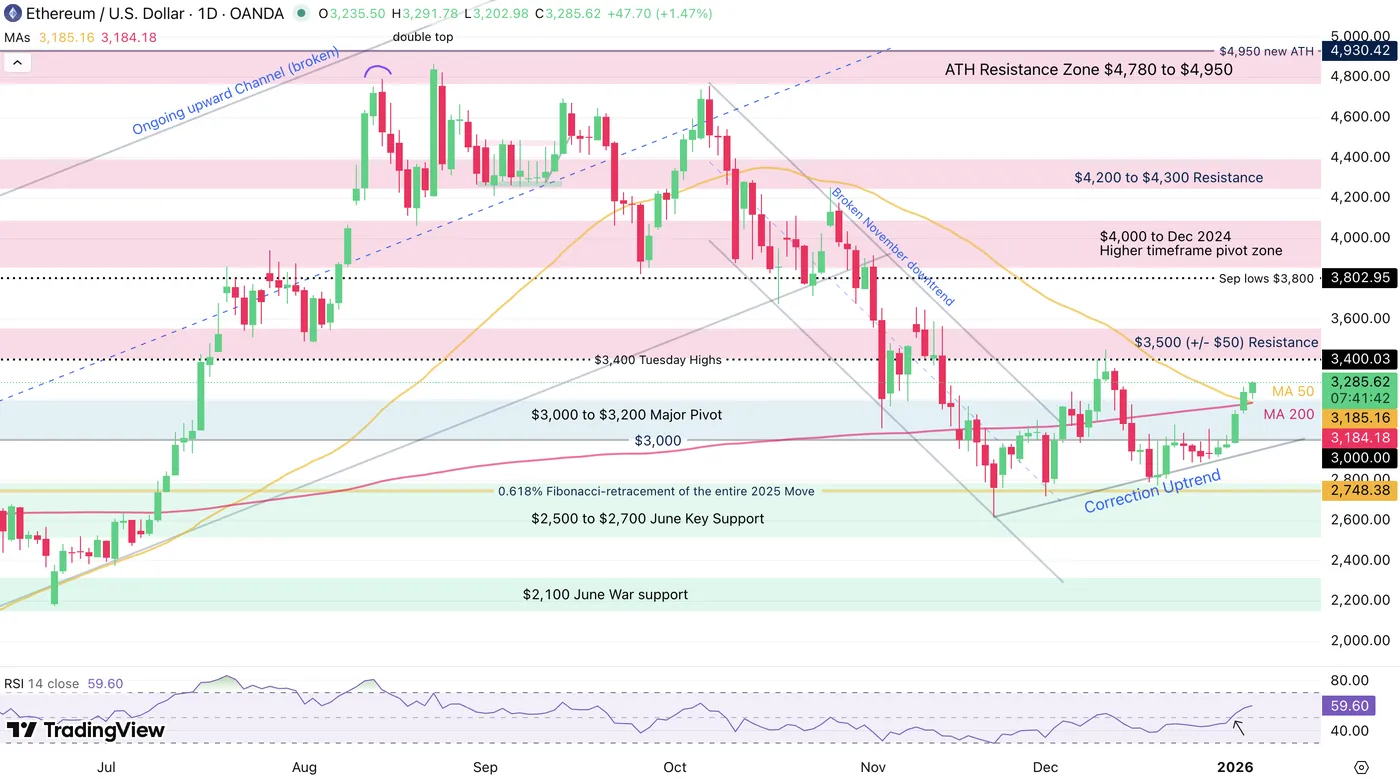
Ethereum (ETH) Daily Chart, January 6, 2026 – Source: TradingView
Ether is actually the most bullish-looking crypto out of all major altcoins., also getting a fundamental boost from its recent upgrade.
Having breached the $3,000 key psychological level and holding above, buyers are forming a bull uptrend above the 50 and 200-Day Moving average – Watch how the bullish trendline holds.
Levels of interest for ETH trading:
Support Levels:
- 50 and 200 Day Moving Averages
- $2,500 to $2,700 June Key Support (November lows)
- $2,620 Session and weekly Lows
- $2,100 June War support
- $1,385 to $1,750 2025 Support
- 2025 Lows $1,384
Resistance Levels:
- $3,000 to $3,200 Major momentum Pivot (Test of the $3,000)
- $3,500 (+/- $50) Resistance and Descending Channel highs
- $3,800 September lows
- $4,000 to Dec 2024 top Higher timeframe Resistance zone
- $4,950 Current new All-time highs
Solana (SOL) Daily Chart and Technical Levels
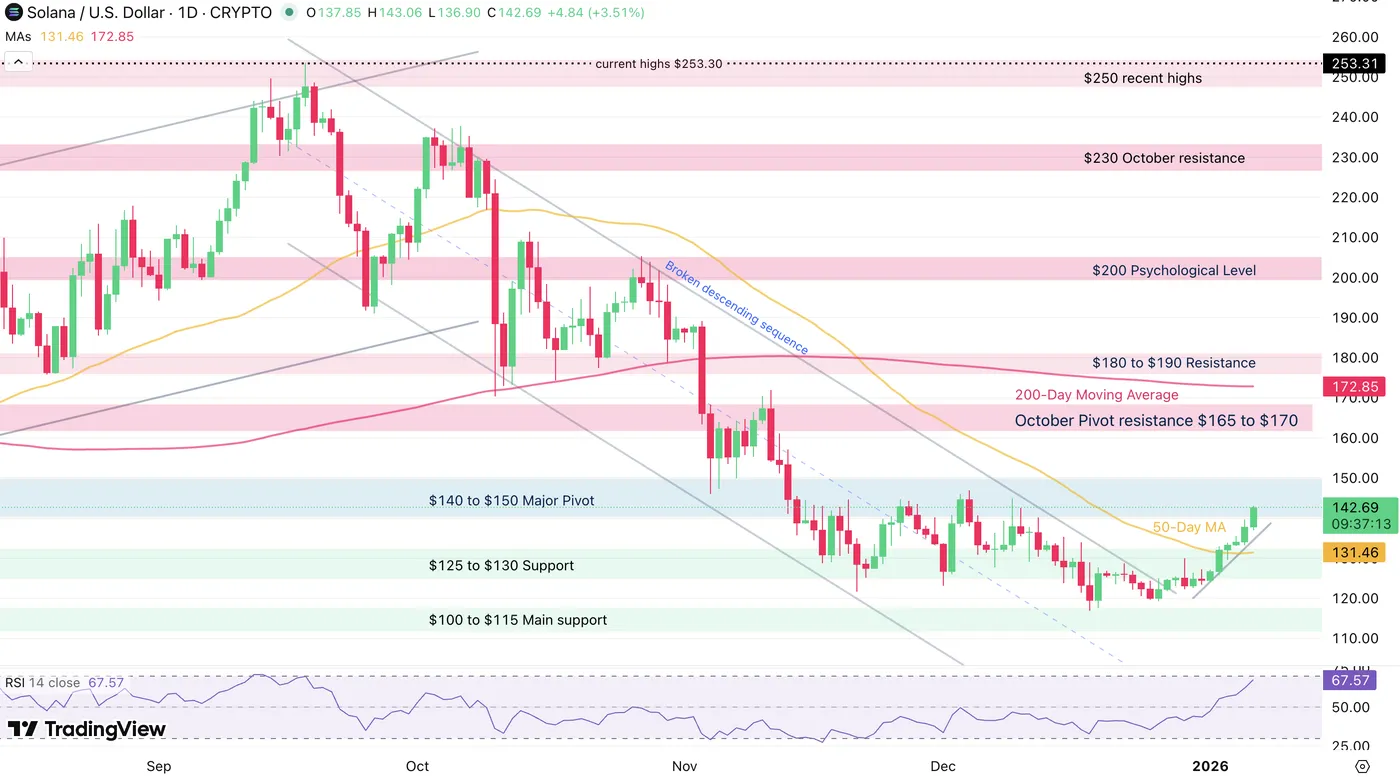
Solana (SOL) Daily Chart, January 6, 2026 – Source: TradingView
The rebound in Solana is looking very decent but still faces key hurdles ahead.
With the price action getting bullish from a 3-month consolidation, bulls will want to break above $150 to relaunch bullish prospects and hold the upward trendline.
Levels to keep on your SOL Charts:
Support Levels:
- Main Support $125 to $130
- Weekly lows $123
- $100 to $115 Main support
Resistance Levels:
- $140 to $150 Major Pivot (testing)
- Channel highs and October Pivot resistance $165 to $170
- $180 to $190 Resistance
- Psychological level $200 to $205
- $253 Cycle highs
Safe Trades and Happy New Year!


