
Key Highlights
- Ethereum started a recovery wave above $3,200 and $3,300.
- ETH is now trading above a bullish trend line with support at $3,000 on the daily chart.
- Bitcoin price gained bullish momentum and settled above $95,000.
- XRP recovered above $2.15 but faces key resistance near $2.25.
Ethereum Technical Analysis
Ethereum started a recovery wave above $3,000. The bulls were able to push ETH above $3,150 and $3,200 before they faced hurdles.
Looking at the daily chart, the price started a decent increase above the 23.6% Fib retracement level of the downward move from the $4,754 swing high to the $2,616 low. The price even surpassed $3,300 before it faced resistance near the 100-day simple moving average (red).
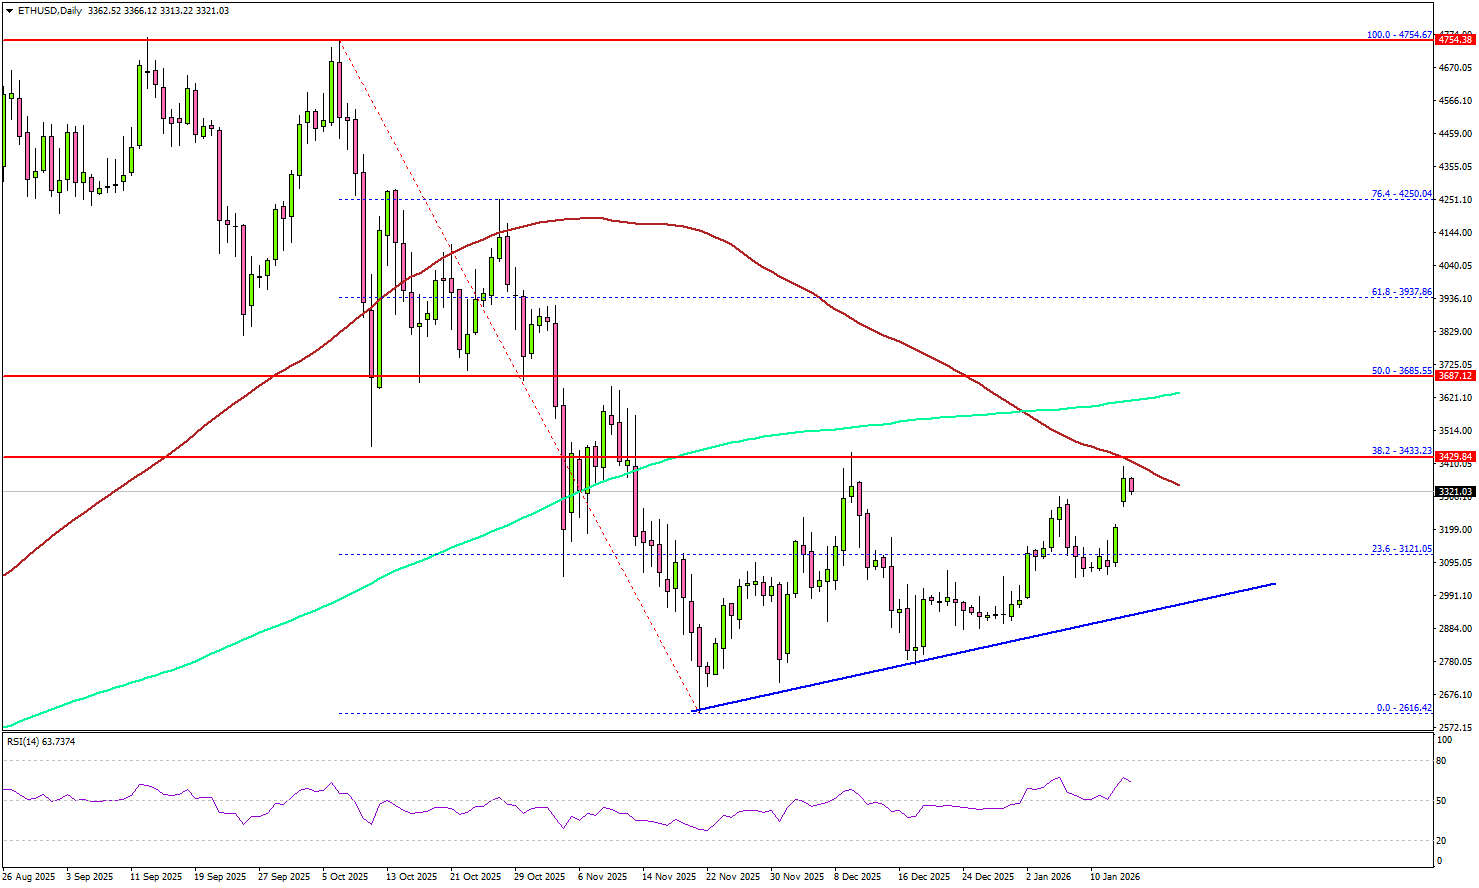
Immediate resistance sits near $3,400. The first key resistance could be near the $3,550 level. The main hurdle for the bulls sits near the 200-day simple moving average (green) at $3,650. The 50% Fib retracement level of the downward move from the $4,754 swing high to the $2,616 low is also near $3,685.
A daily close above the $3,685 resistance zone could start another steady increase. In the stated case, the price may perhaps rise toward the $3,800 level.
On the downside, the bulls might be active near $3,220 and $3,200. The main support is now forming near $3,000, below which the price could slide toward $2,880. Any more losses might call for a move toward $2,620.
Looking at Bitcoin, there was a decent increase, and the bulls were able to push the price above the key resistance at $95,500.
Economic Releases
- US Initial Jobless Claims – Forecast 215K, versus 208K previous.
- NY Empire State Manufacturing Index for Jan 2025 – Forecast 1, versus -3.9 previous.