
- Oil gives back its Iran-led premium as tensions abate
- Exploring Technical Analysis to see where things currently stand
- Looking at how any possible surprise could affect WTI prices
Prices were indeed reaching extremes. Yesterday’s surge to $62 was met with a sharp, one-way correction back to the low $59s, with the commodity actually finishing the session lower by 1%.
The premium was built on the perception that a US intervention in Iran was imminent.
The movement of US Army assets from nearby bases, including Al-Udeid in Qatar, was seen as a concrete sign of incoming action, as these foreign bases could be targets for shorter-range Iranian missiles.
However, recent reports suggest that Gulf leaders—including those from Qatar, Saudi Arabia, and Oman—persuaded the US President to walk back his threats.
The compromise stems from US reluctance to get bogged down in a prolonged war if limited intervention fails to trigger regime change—a risk heavily emphasized by US strategic counselors.
Still, the revolts show no signs of easing. The pain for Iranian civilians is real, as they face the weakest Rial in history amidst extreme inflation, power and water outages, and record air pollution.
Looking at betting markets, this dynamic is far from over. Odds for an attack before the end of the month still hover around 30%.

Betting Odds of a US intervention in Iran – Source: Polymarket
The Trump Admin calls for an emergency UN Security Council meeting regarding the issue. Keep a close eye on the headlines regarding such.
We will dive into a multi-timeframe analysis of the WTI (US) Oil to determine potential price levels in the event of an US intervention or lack thereof.
US Oil Intraday Timeframe Analysis
WTI 4H Chart and Technical Levels
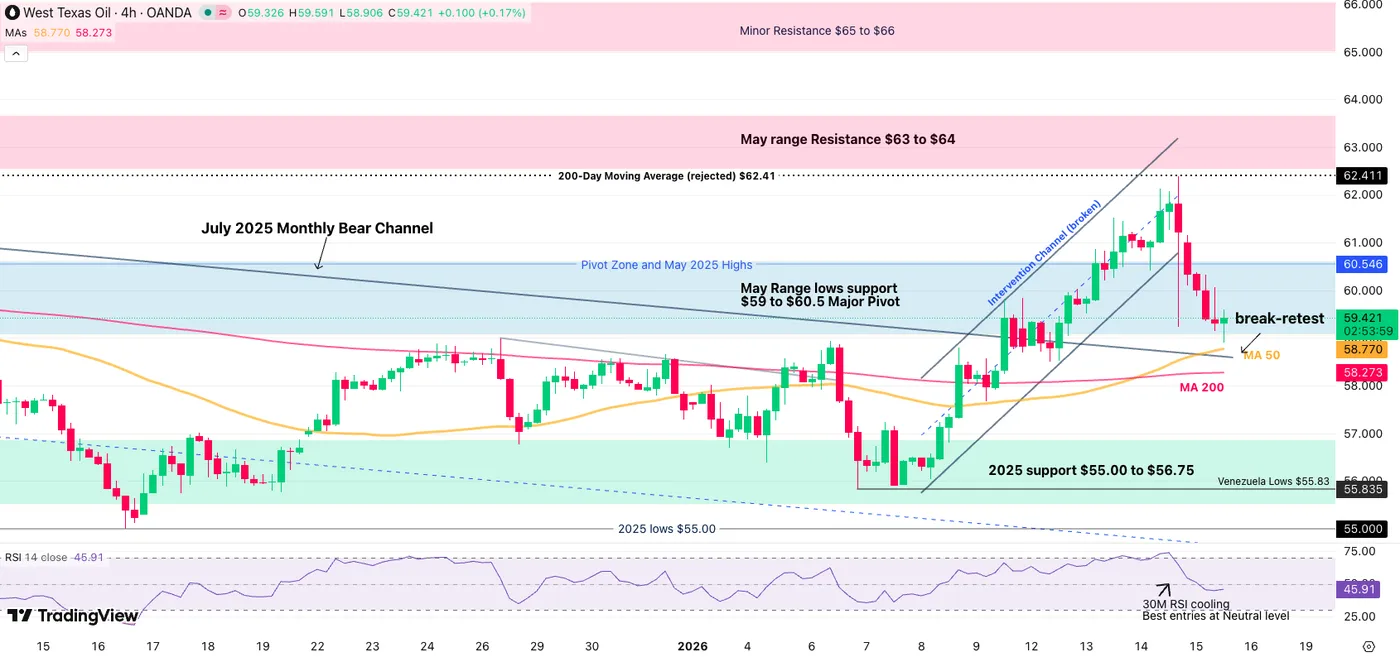
WTI Oil 4H Chart – January 15, 2026. Source: TradingView
After yesterday’s scenario analysis, WTI prices did really respond to the 200-Day Moving Average at $62.40 as the dynamic for an immediate intervention stalled.
In event-based trading, it is essential to mark upper and lower bounds for scenarios; From yesterday’s example:
- Breaking above the 200-Day MA implied heightened volatility expectations
- Rejecting it would mean lower tensions
So where are we today?
Having broken the upward impulse, the premium unwinding is leading to the immediate retest of the July Monthly Bear Channel which provides support and a lower bound for action.
- Holding the channel highs ($58.50 to $59.30) implies that traders still haven’t given up entirely on the event
- Breaking below (re-entering the bear channel), translates into an intervention that is not a high-probability event anymore.
- Any surprise rally above yesterday’s highs ($62.41), particularly on high volume and pace, is a trigger to know that the hammer is going down.
WTI Technical Levels
Levels to place on your WTI charts:
Resistance Levels
- $60.50 Pivot Zone top
- $62.40 Past day highs (Above mean tensions)
- Resistance May 2025 Range $63 to $64
- Key September Resistance $65 to $66
Support Levels
- $58.50 to $59.30 Break-Retest Zone at Bear Channel Highs (+ 4H 50-MA)
- $57.70 Friday lows mini support
- Venezuela Lows $55.83
- $55 to $56.50 2025 Support and Channel lows
30M Chart and Trading Setups
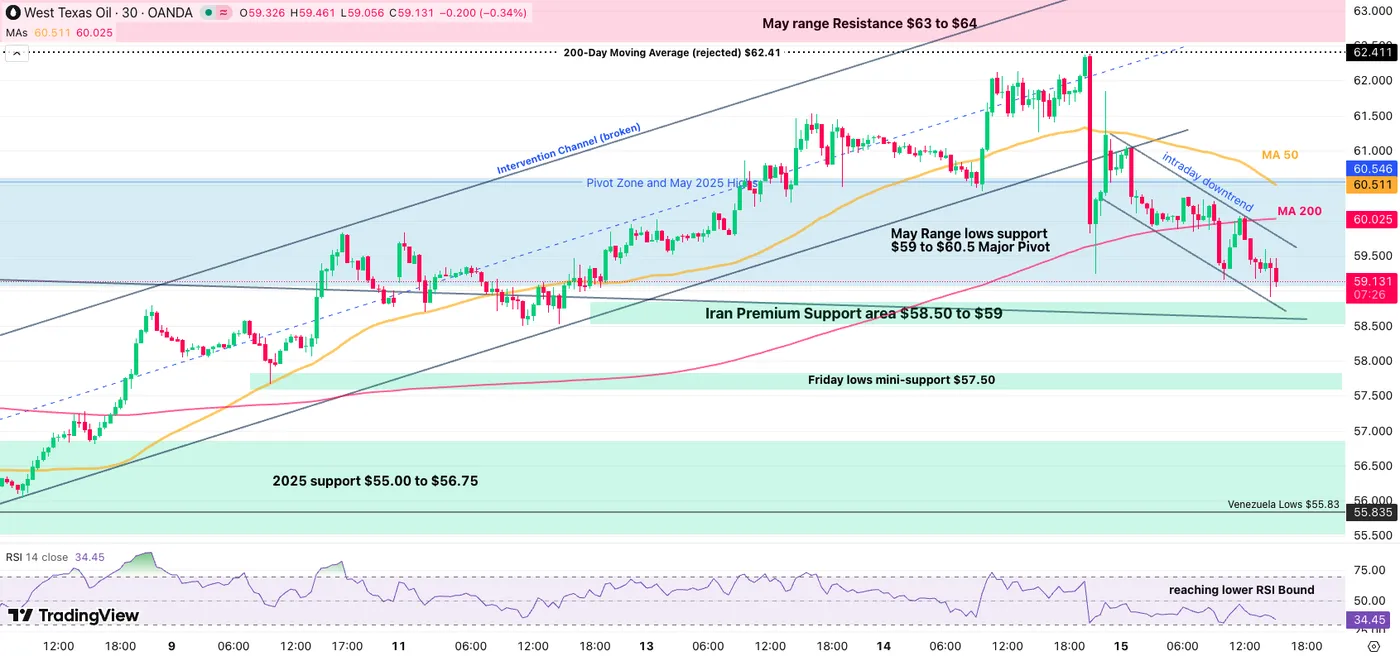
WTI Oil 30M Chart – January 15, 2026. Source: TradingView
Looking closer to short-timeframes, the premium is progressively decreasing in a downward intraday trend – A small bear channel.
Breaking below the Iran Premium Support area $58.50 to $59 would be the final level to assume that the event is fully done.
However, breaking above the intraday channel however doesn’t necessarily mean that the event is fully back: It will depend on the pace of the breakout.
- With traders exposing themselves again as prices correct, plus a technical break-retest, a rebound here would not be surprising.
- A slow grind higher could establish a range to $60.50
- A sudden explosion higher however confirms that things are heating up
- In the event of a breakout above the previous day highs, WTI prices could easily go between $65 (conservative) to $80 for the most extreme case.
- Holding the channel to break below the support would lead to a re-entering of the July bear channel.
Safe Trades and Stay in Touch with the Latest News!