Hello fellow traders. In this technical article we’re going to look at the Elliott Wave charts of EURUSD forex pair published in members area of the website. The pair has recently given us Double Three pull back and found buyers again precisely at the equal legs area as we expected. In the following text, we’ll explain the Elliott Wave count.
EURUSD Elliott Wave 4 Hour Chart 01.12.2026
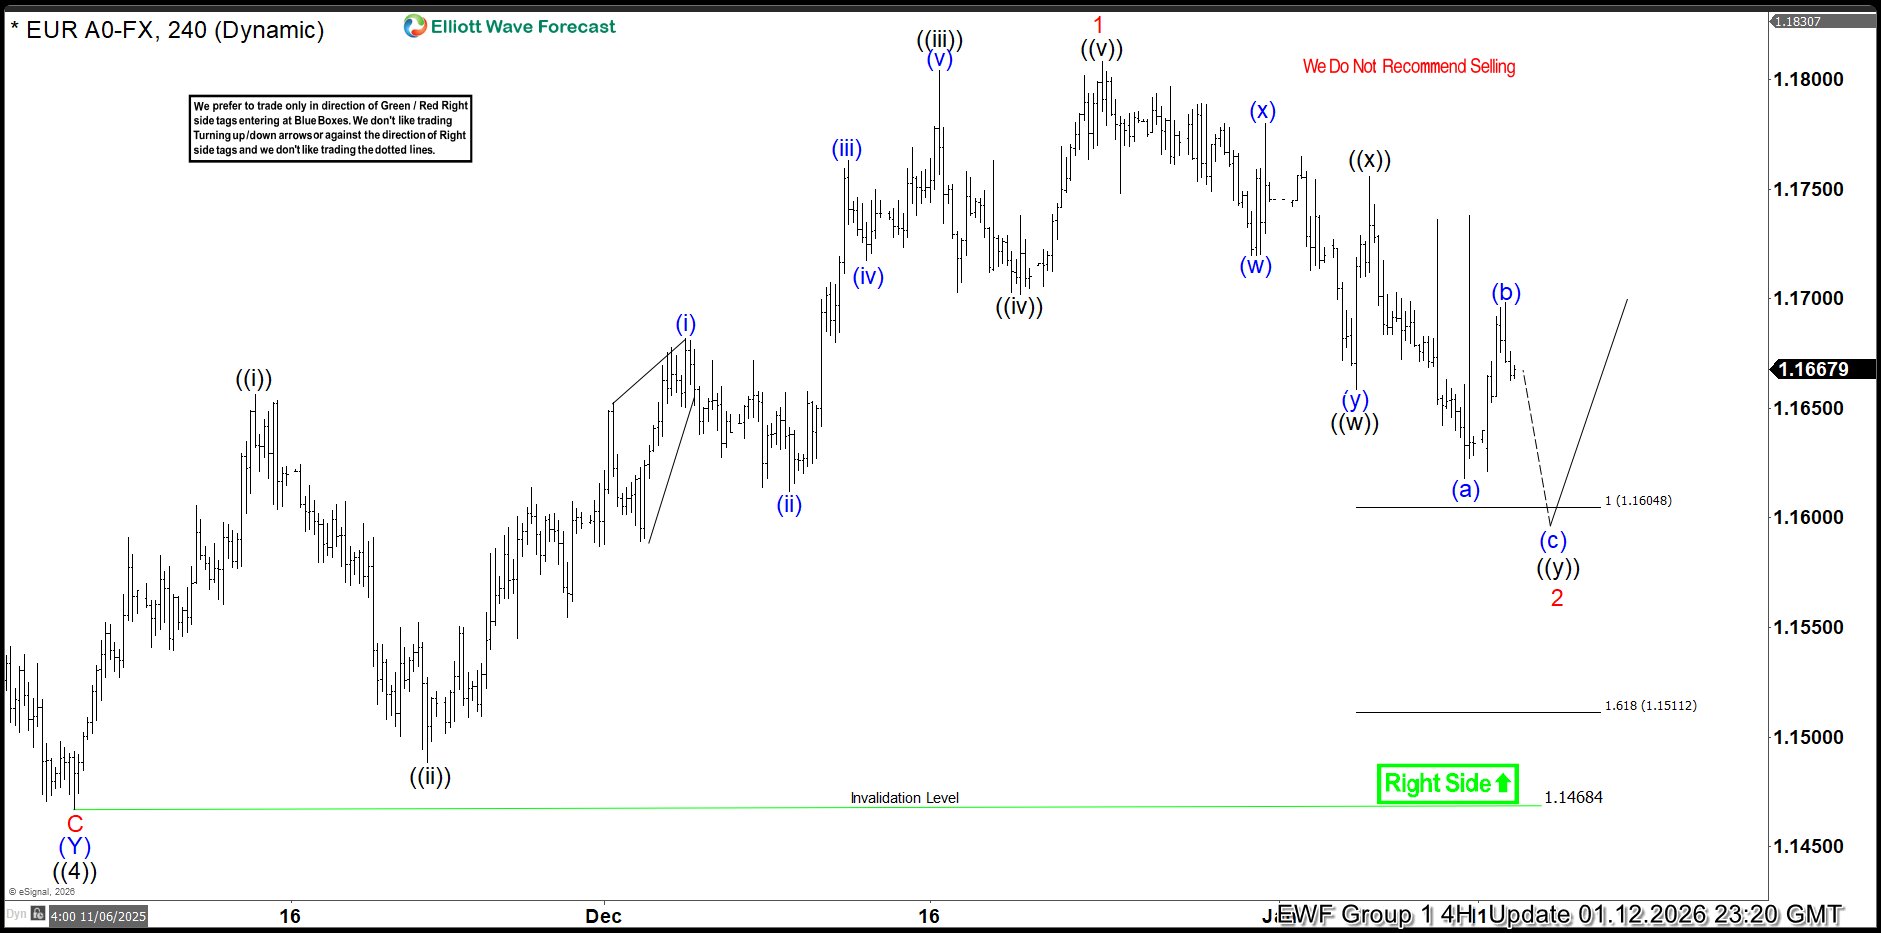
EURUSD is currently forming an intraday three-wave pullback from recent highs. We identified a buying zone by measuring the Equal Legs area using the Fibonacci extension tool, with ((w)) projected relative to ((x)). The ideal support area comes in at 1.16048–1.15112. The correction is not complete yet, and the pair could see more downside in the near term toward the marked buying zone. As long as price holds within this region, we expect buyers to step in and the rally to resume toward new highs.
EURUSD Elliott Wave 4 Hour Chart 01.12.2026
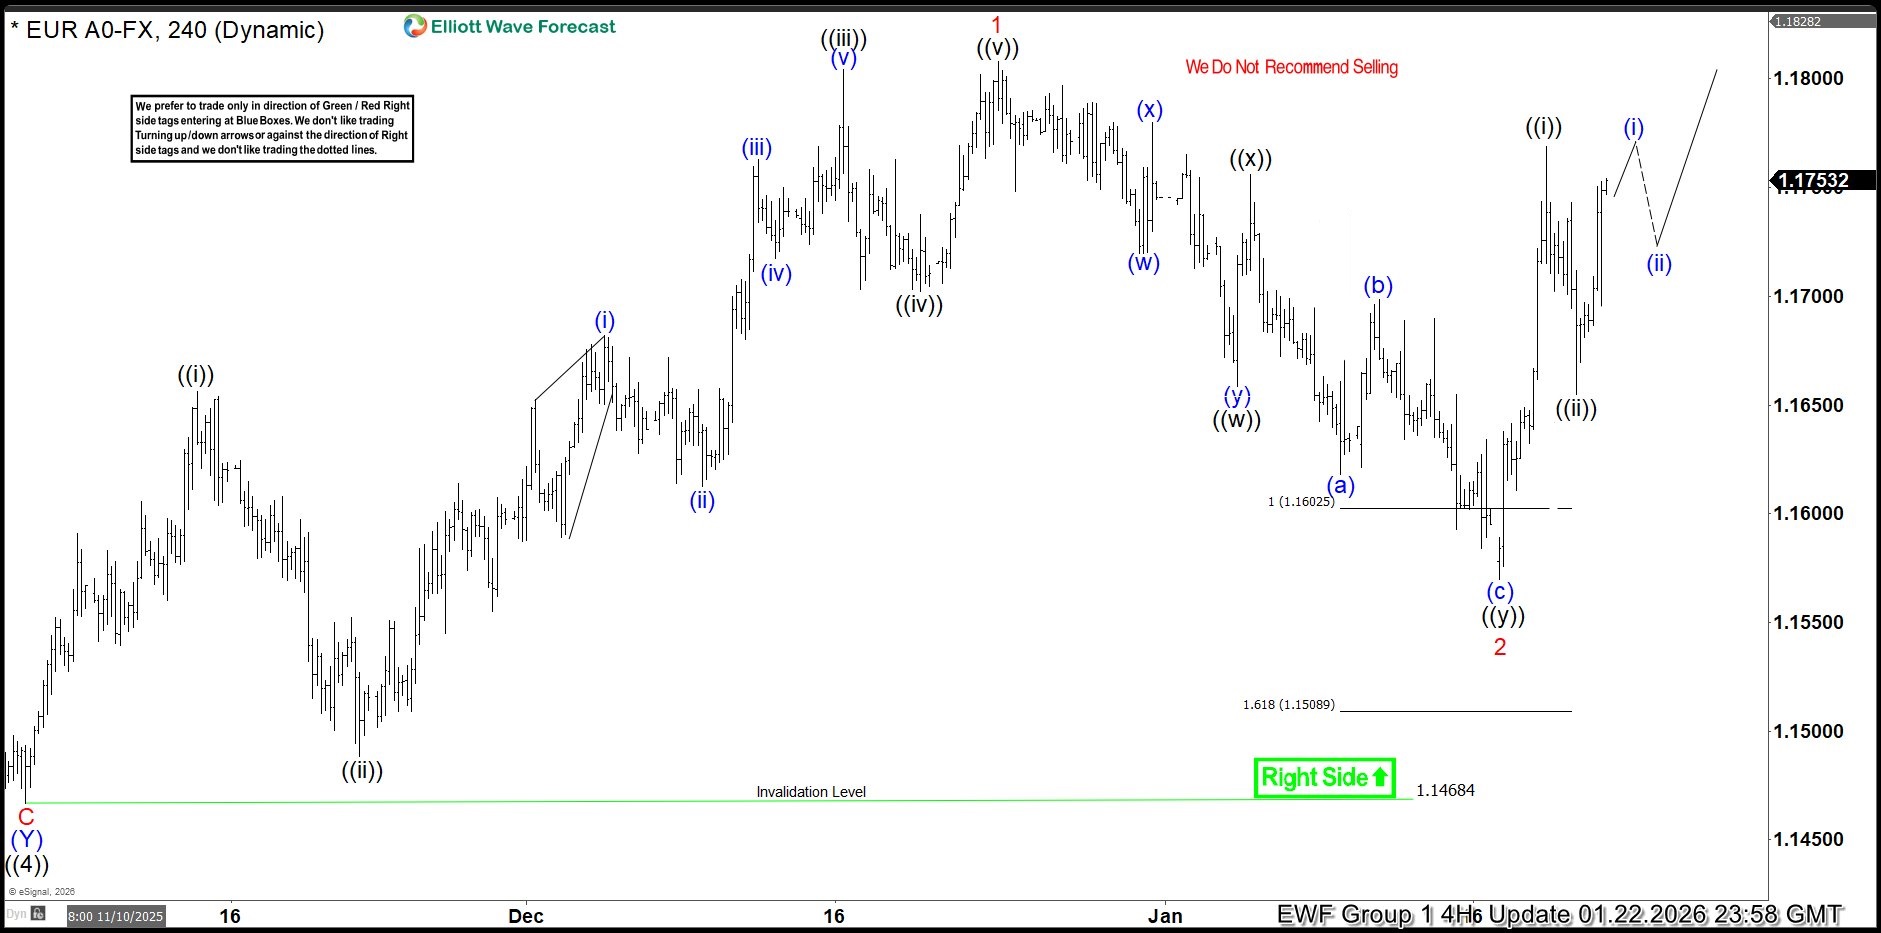
The pair has found buyers at the Equal Legs zone , just as expected. The correction ended at the 1.15709 low, and since then, EURUSD is giving us a rally. As a result, any long positions from the equal legs zone are now risk-free.