
USDCHF has provided traders with a textbook example of how Fibonacci extension zones can act as powerful resistance. After an extended move higher, price reached the 0.8020–0.8092 extension area, where sellers decisively stepped in. The rejection at this zone not only halted the advance but triggered a fresh wave of decline, reinforcing the importance of monitoring these levels for potential reversals. For traders, this setup highlights how extension zones can sharpen risk management, offer clear invalidation points, and reveal where market sentiment shifts from bullish exhaustion to renewed bearish momentum. The following charts illustrate how price action unfolded around the Fibonacci extension zone, highlighting the rejection and subsequent decline.
USDCHF 4‑Hour Chart (Jan 18): Sellers Emerged at 0.8020–0.8092, Rejecting Resistance and Driving Price Lower
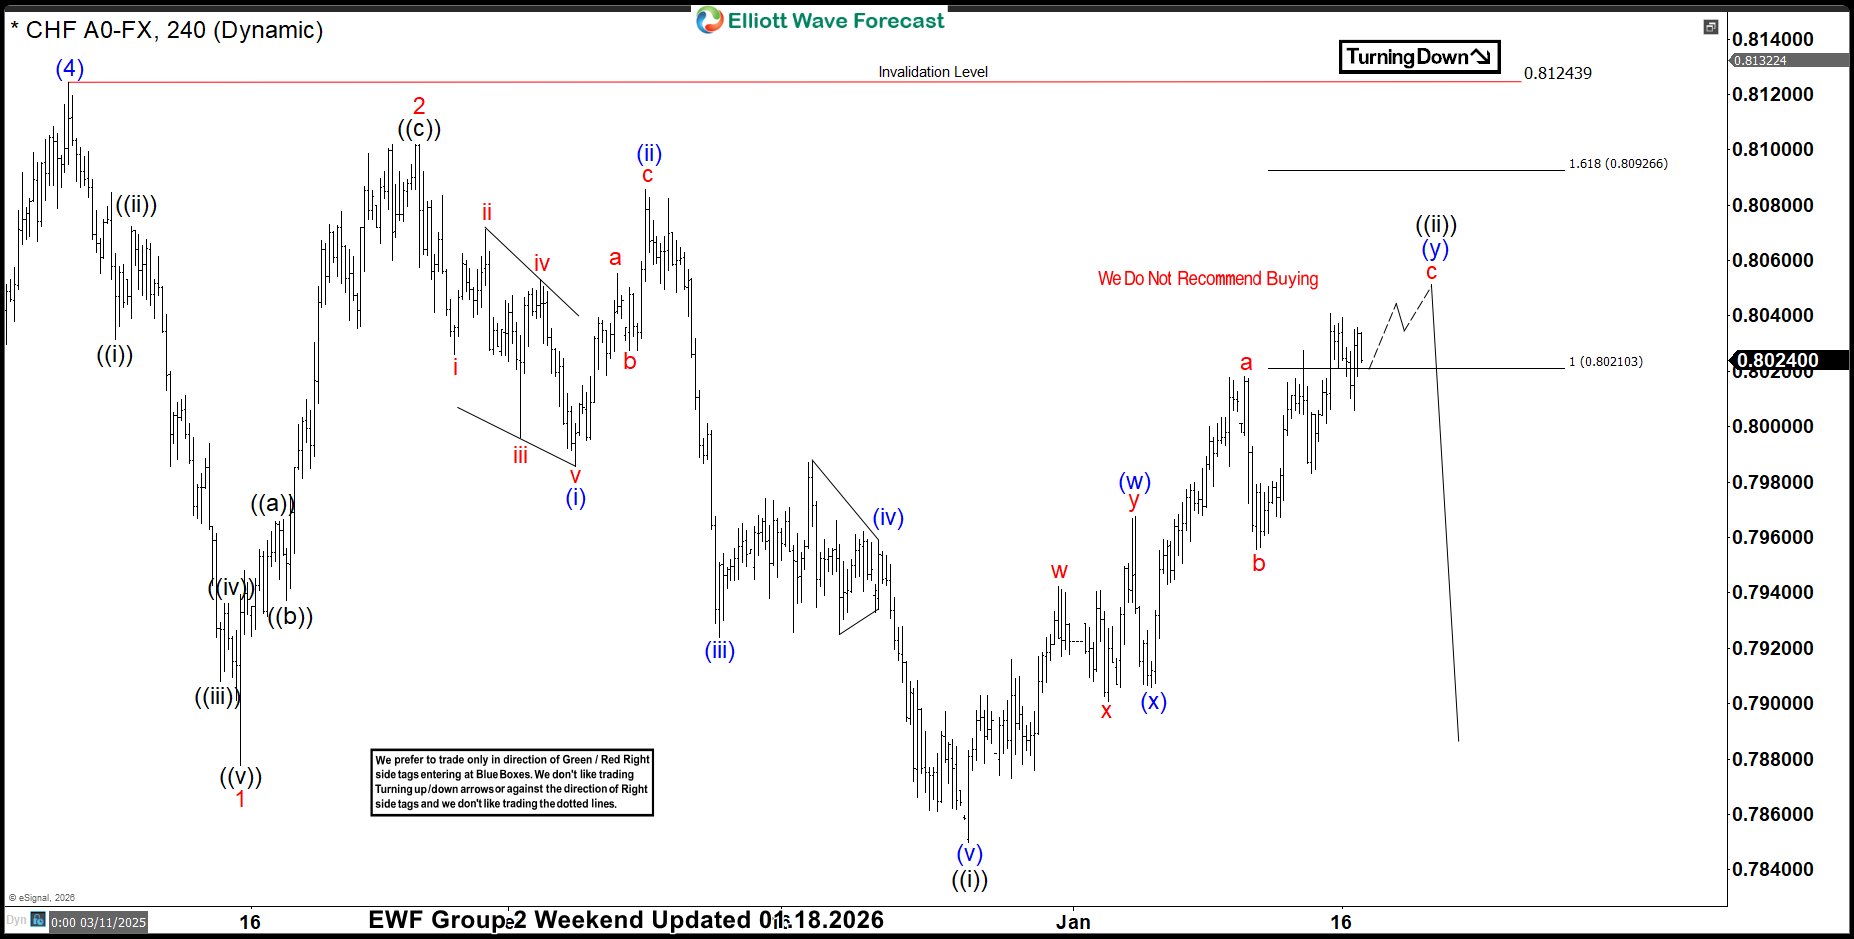
The decline in USDCHF from the November 5 peak unfolded in three waves, suggesting that subsequent bounces were likely to fail in either 3, 7, or 11 swings for an extension lower as far as November 25 high remained intacct. The 4‑hour chart from January 18 captures the advance from the December 25 low, which developed in seven swings and was expected to terminate between 0.8020–0.8092 before the downtrend resumed. The 0.81018 level serves as the key invalidation point—holding below this resistance keeps the bearish view intact and reinforces the expectation of further decline.
USDCHF 4‑Hour Chart (Jan 26): Sellers defended 0.8020–0.8092, breaking September 17 low and driving wave ((iii)) lower.
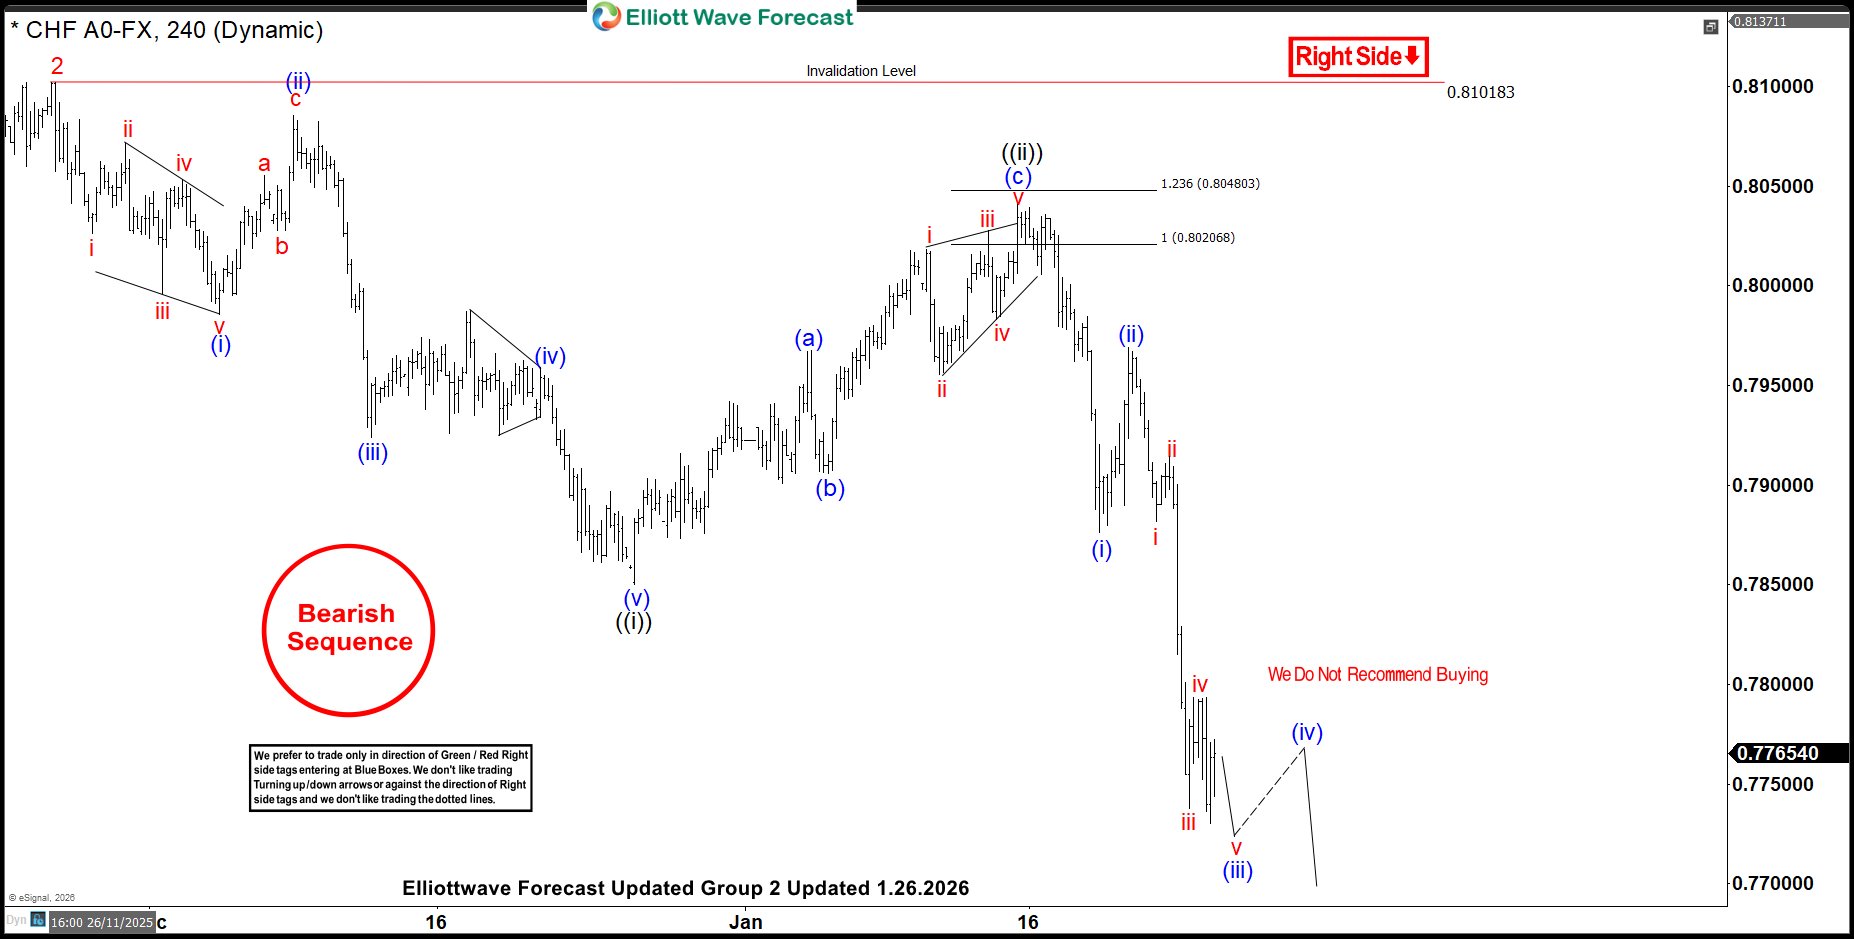
USDCHF Jan 26 4 Hour Elliott Wave ChartUSDCHF found sellers in the 0.8020–0.8092 Fibonacci extension area and resumed its decline. Price has already broken below the September 17 low and is currently unfolding wave ((iii)) of 3 down from the November 5 peak. The pair has reached the 100% Fibonacci extension of wave ((i)) relative to wave ((ii)), but ideally should extend toward 0.7625, which represents the 161.8% extension—a typical level for wave ((iii)) to complete. In the near term, any corrective bounces are expected to fail in 3, 7, or 11 swings, offering traders short‑term selling opportunities for further downside.
The rejection at the 0.8020–0.8092 zone and the unfolding wave ((iii)) decline highlight how Fibonacci extensions and Elliott Wave structures can provide traders with a clear technical roadmap. Staying ahead of these setups requires timely analysis and disciplined execution. By joining our services, traders gain access to real‑time charts, actionable forecasts, and educational insights designed to sharpen decision‑making and keep them ahead of the crowd. If you want to consistently spot opportunities like this USDCHF setup and Blue Box Trade Setups before the market reacts, our community and resources are built to guide you every step of the way!