
Key Highlights
- EUR/USD started a fresh decline from 1.2080.
- It traded below a key bullish trend line with support at 1.1880 on the 4-hour chart.
- GBP/USD trimmed some gains and traded below 1.3800.
- Bitcoin declined by over 10%, and Ethereum dived 20%.
EUR/USD Technical Analysis
The Euro rallied above 1.1800 and 1.2000 against the US Dollar. EUR/USD traded as high as 1.2082 before there was a pullback.
Looking at the 4-hour chart, the pair traded below a key bullish trend line with support at 1.1880 to start the recent decline. The pair dipped below the 38.2% Fib retracement level of the upward move from the 1.1577 swing low to the 1.2083 high.
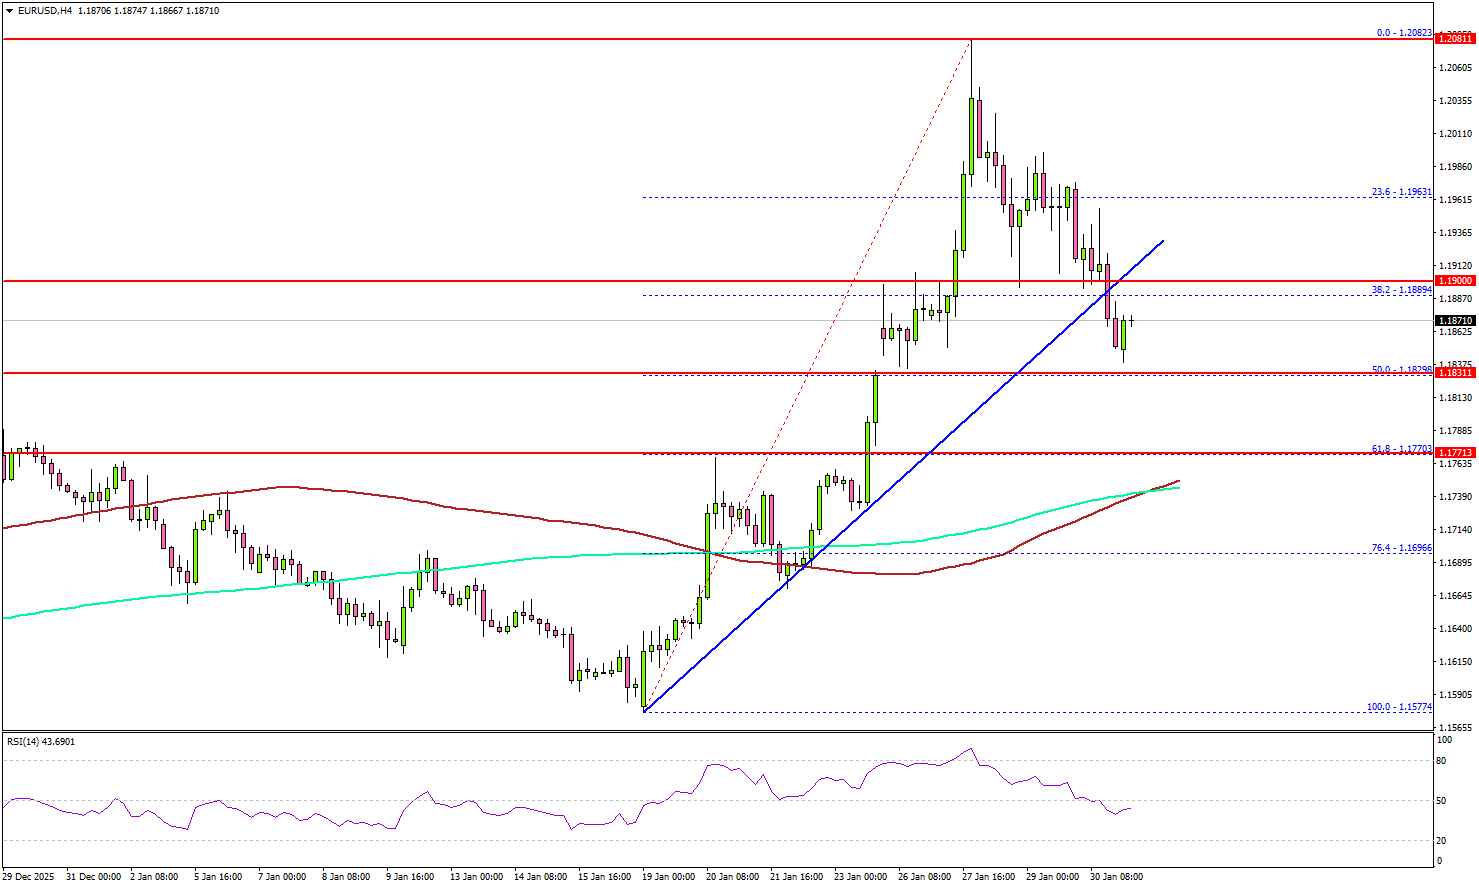
Immediate support could be 1.1820 or the 50% Fib retracement level of the upward move from the 1.1577 swing low to the 1.2083 high. The first major area for the bulls might be near 1.1800.
The main support sits at 1.1770, below which the pair might test the 200 simple moving average (green, 4-hour) and the 100 simple moving average (red, 4-hour).
If there is a fresh increase, the pair could face resistance near 1.1910. The first key hurdle could be 1.1940. The next stop for the bulls might be 1.1960, where they could face hurdles. A close above 1.1960 could open the doors for more gains. In the stated case, the bulls could aim for a move toward 1.2080.
Looking at GBP/USD, the pair peaked near 1.3880 and recently started a downside correction below 1.3800.
Upcoming Key Economic Events:
- Euro Zone Manufacturing PMI for Jan 2026 – Forecast 49.4, versus 49.4 previous.
- UK Manufacturing PMI for Jan 2026 – Forecast 51.6, versus 51.6 previous.
- US S&P Global Manufacturing PMI for Jan 2026 – Forecast 51.9, versus 51.9 previous.
- US ISM Manufacturing PMI for Jan 2026 – Forecast 48.3, versus 47.9 previous.