, trading near 1.3670. The pair sits at a technical inflection point as markets await key releases from both economies – US PPI and Canadian GDP – which could help shift directional bias. Oil price dynamics also remain important, with supply concerns potentially limiting upside for the pair.)
- USDCAD drifts sideways between the 20- and 50-day SMAs.
- Momentum indicators reflect a wait‑and‑see stance.
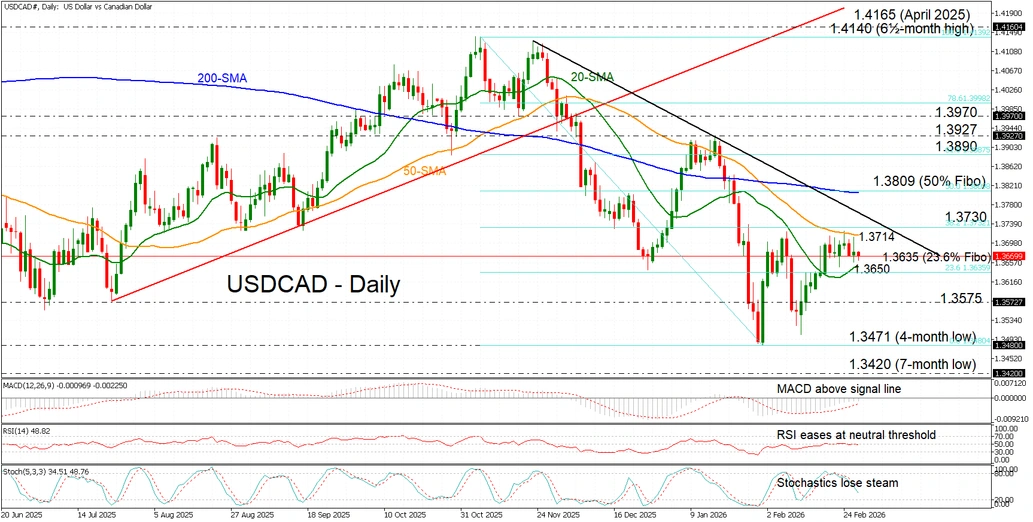
USDCAD continues to consolidate within the tight 1.3650-1.3710 range defined by the 20‑ and 50‑day simple moving averages (SMAs), trading near 1.3670. The pair sits at a technical inflection point as markets await key releases from both economies – US PPI and Canadian GDP – which could help shift directional bias. Oil price dynamics also remain important, with supply concerns potentially limiting upside for the pair.
The momentum indicators reinforce the indecisive tone – the RSI is flatlining around the neutral 50 level, the MACD is edging slightly higher from negative territory, and the stochastics are losing momentum near the midline, collectively mirroring the lack of clear direction.
A decisive break above the 50‑day SMA at 1.3714 and the 38.2% Fibonacci retracement of the November-January decline at 1.3730, where the short-term downtrend also intersects, could tilt the bias to the upside. Such a move would open the door toward the 200‑day SMA near the 50% Fibonacci level at 1.3809, which currently forms a death‑cross structure with the 50‑day SMA.
Conversely, initial support lies at the 20‑day SMA at 1.3650, positioned just above the 23.6% Fibonacci level at 1.3638. Below that, support extends to 1.3575 and the four‑month low near 1.3471 recorded earlier this month.
Overall, USDCAD remains range‑bound, with the rebound from four‑month lows stalling and the broader downtrend intact as markets await key catalysts to set direction.